
Archetype AI Team
What Is AI-Based Predictive Maintenance?
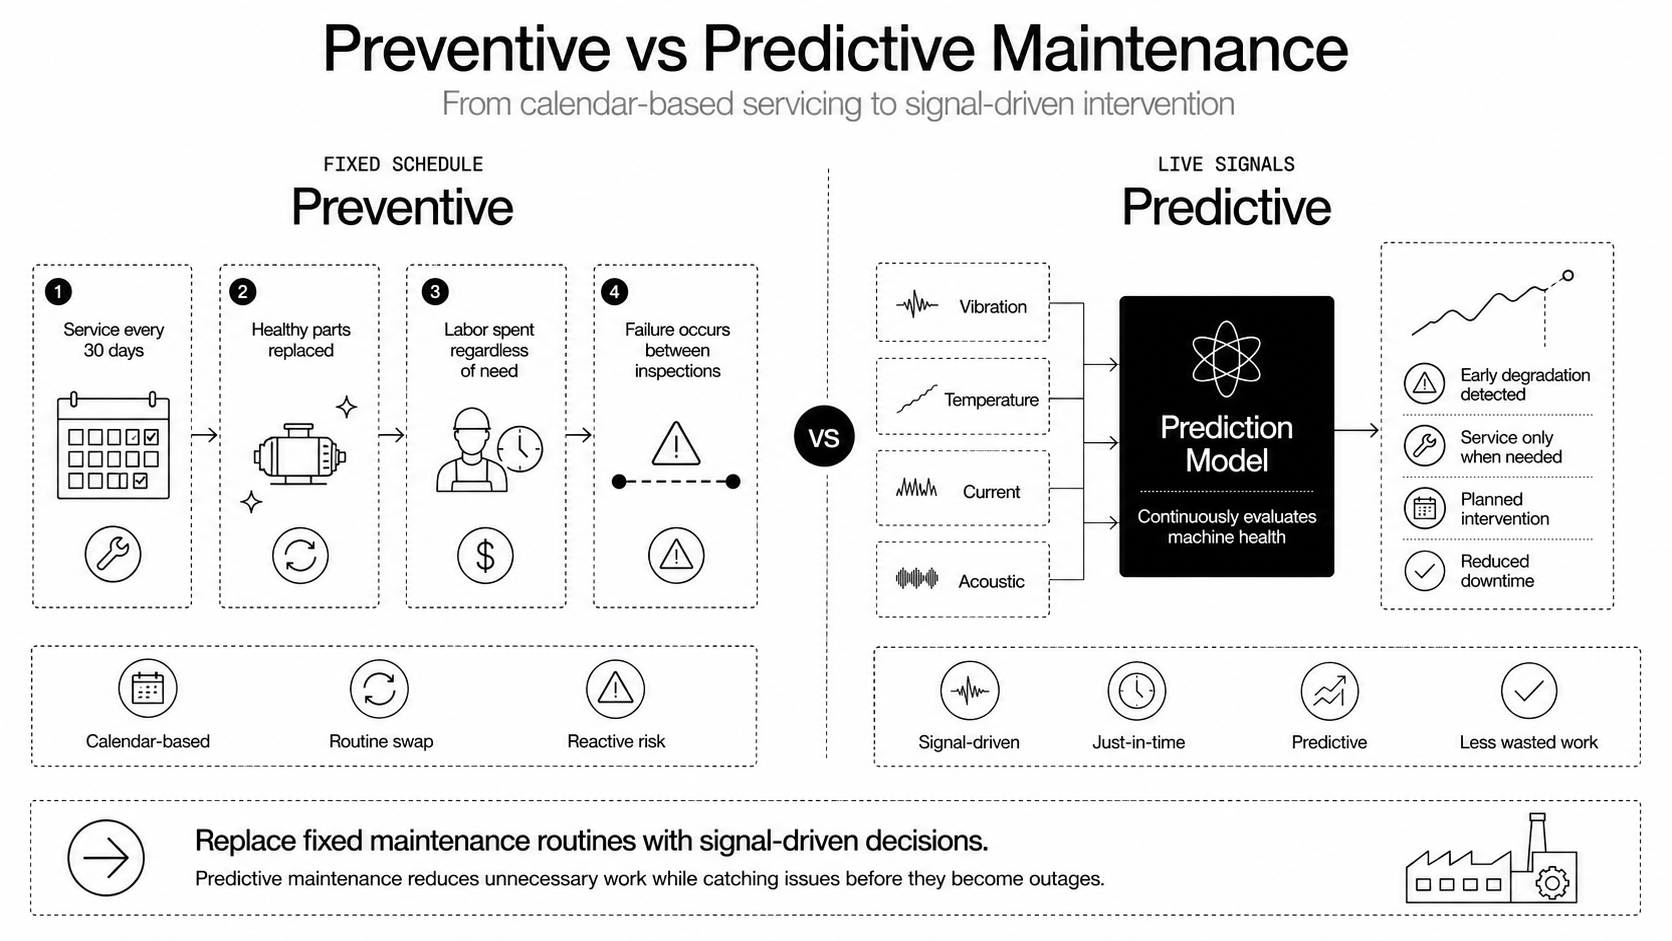
How Predictive Maintenance Differs From Preventive Care
Predictive maintenance uses data and models to forecast when a component will fail, so you intervene just in time. Preventive care schedules service on fixed intervals, regardless of actual condition. Preventive work detects obvious failures, but it wastes parts and labor when assets are healthy. Predictive approaches cut unnecessary work and catch problems that scheduled checks miss, because they react to real signals instead of a calendar. That transition moves teams from logistics and checklists to signal analysis and risk-based decision making.
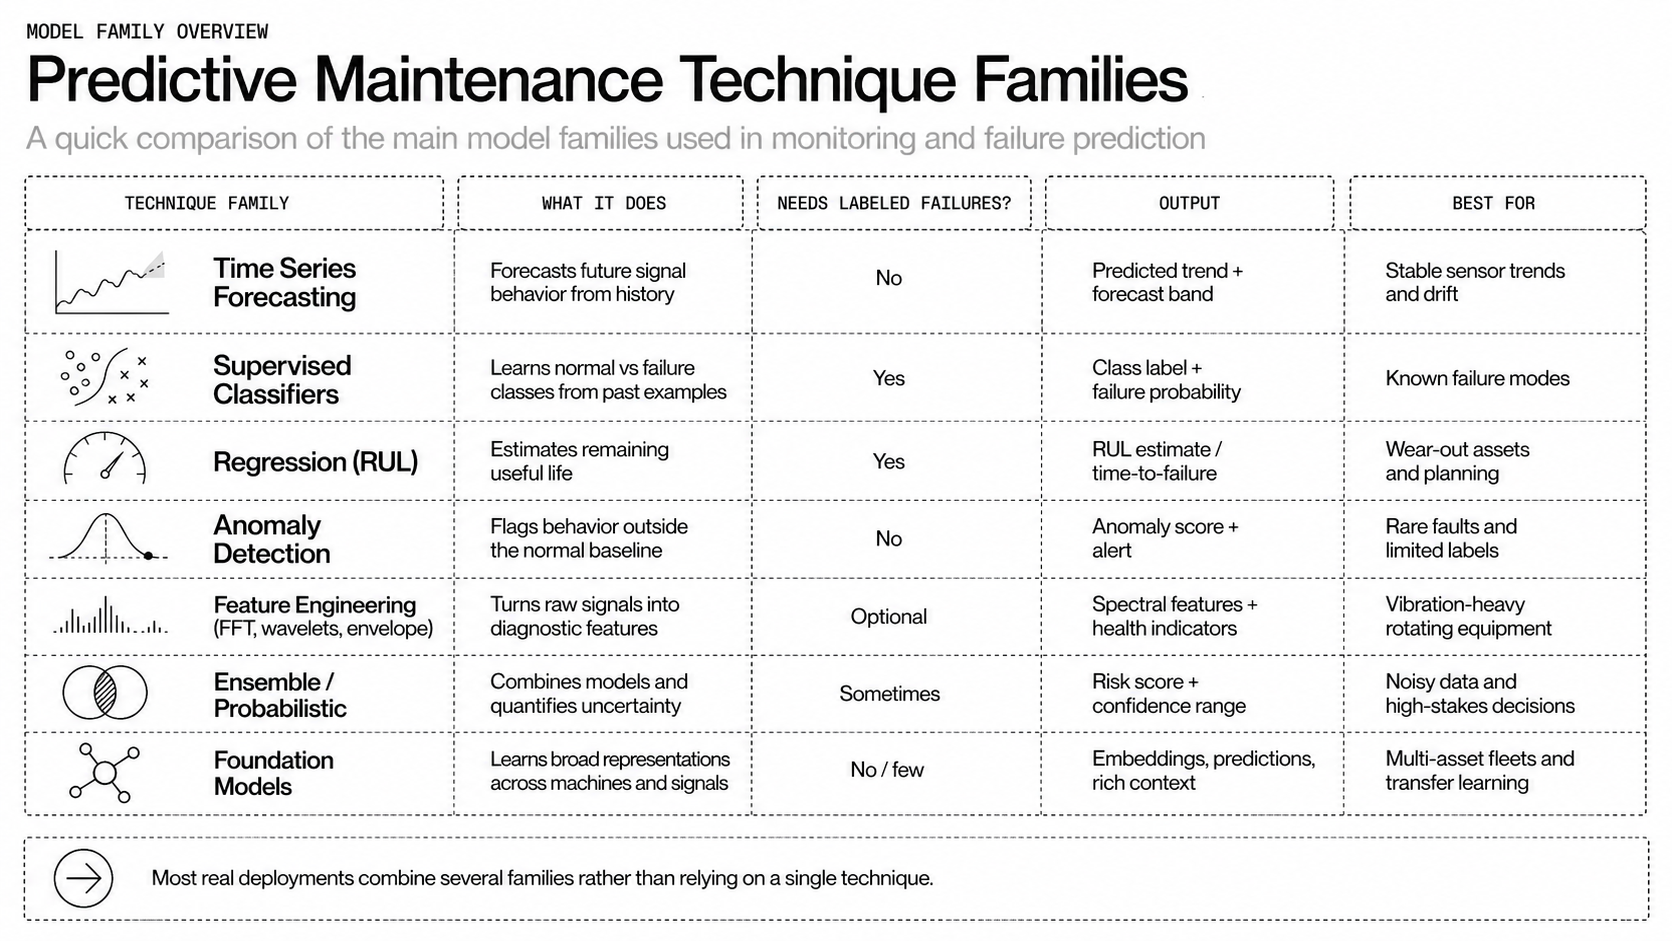
Which AI Techniques Power Predictions
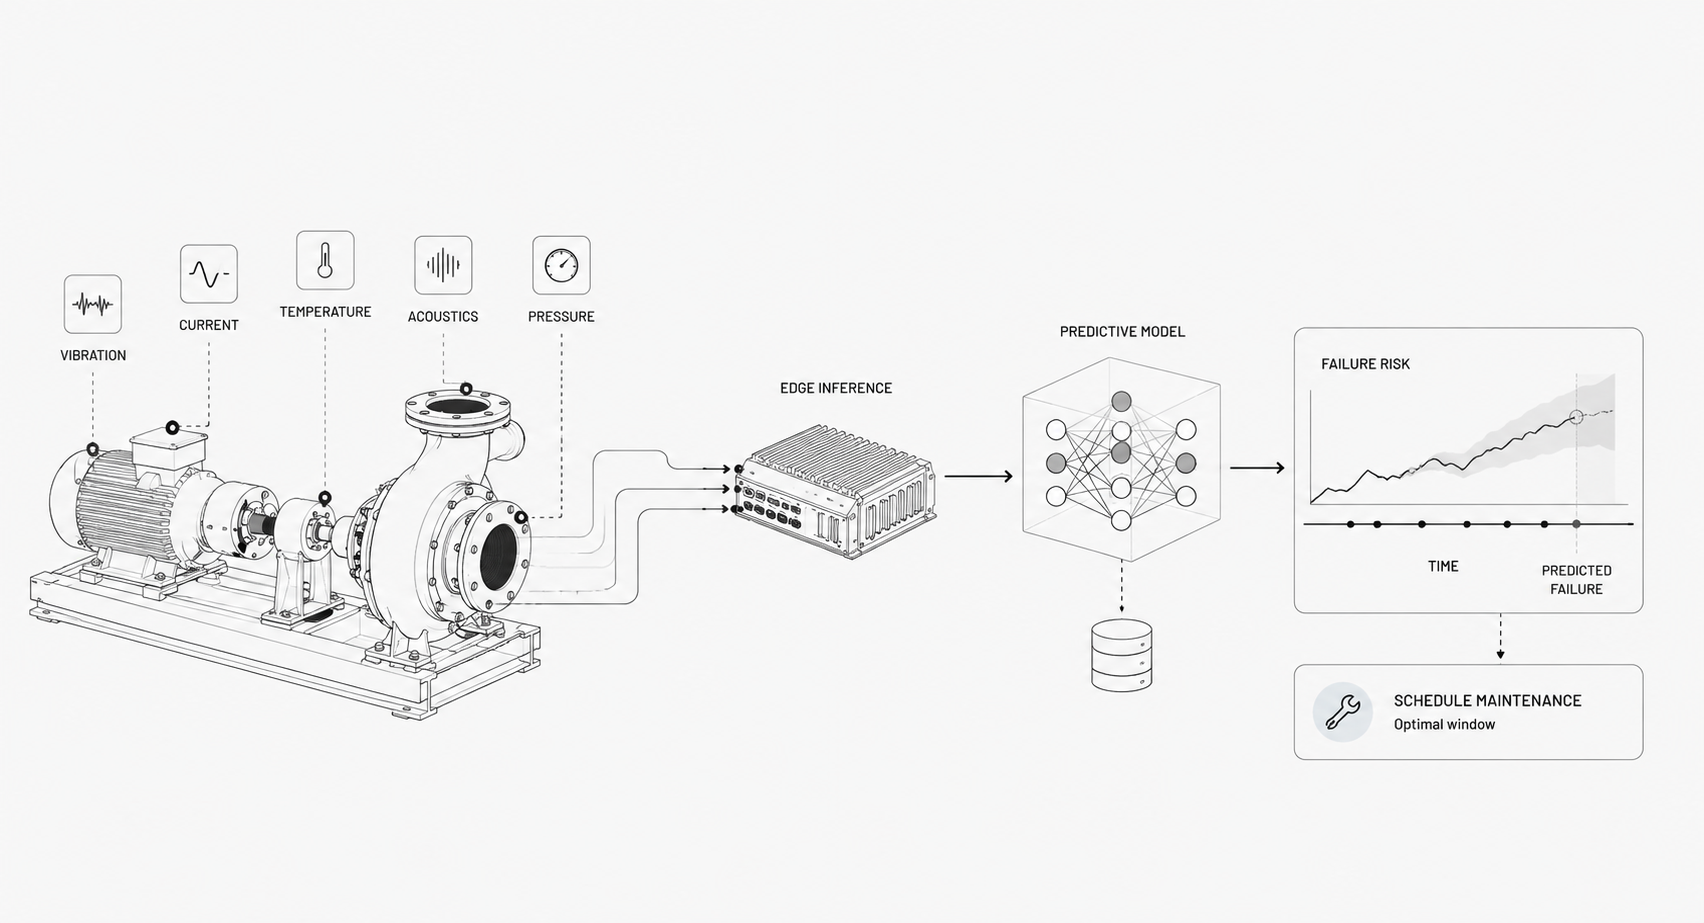
A handful of techniques dominate predictive maintenance. Time series models forecast normal behavior and expose drift. Supervised classifiers predict discrete failure modes when labeled incidents exist. Regression models estimate remaining useful life as a continuous value. Anomaly detectors spot deviations without labels, useful when failures are rare. Feature engineering methods such as FFT, wavelets, and envelope analysis turn raw waveforms into predictive inputs. Ensemble methods and probabilistic models give calibrated risk scores, which operations teams can act on.
Foundation models for physical signals are emerging, they learn generalizable patterns across machines and sites, letting teams build domain-specific intelligence faster. Newton, Archetype's Physical AI foundation model, demonstrates this approach — trained self-supervised on nearly 600 million real-world sensor measurements, it fuses signals across vibration, current, temperature, acoustics, and video into a unified understanding of machine behavior, then generalizes across equipment types and domains without task-specific retraining.
What Outcomes Teams Should Expect
Expect fewer surprise outages and shorter mean time to repair, quickly. Early projects usually cut downtime by double digits within months, because simple vibration or current models expose imminent failures. Expect inventory optimization, fewer emergency orders, and smoother workforce planning. You’ll also get earlier warnings that let crews diagnose remotely, reducing truck rolls.
Over time the program surfaces systemic issues, like design weaknesses or operational habits that shorten life, so asset lifetime improves. Teams that build this infrastructure gain an advantage, they can reuse models and data to accelerate new assets and sites.
The scale of the opportunity is significant: an estimated 70–90% of industrial sensor data still goes unused because traditional approaches require bespoke models for every asset and use case. Physical AI foundation models change that equation by interpreting diverse sensor types out of the box, converting previously untouched data into operational intelligence.
Why Invest In Predictive Maintenance?
How It Reduces Downtime And Costs
Predictive systems detect degrading components long before catastrophic failure. That translates into planned repairs during low-impact windows, not emergency stops. Planned work is cheaper: parts are ordered ahead, labor is scheduled, and multiple fixes can be bundled.
Preventive replacements decrease, because you stop replacing healthy items on a calendar. The result: fewer outages, lower spare-part carrying costs, and reduced overtime. For many operators, those savings cover tooling and first-year analytics costs.
How It Improves Asset Lifetime And Safety
Catching faults early prevents secondary damage that accelerates wear. A small bearing fault fixed early stops it from damaging shafts and housings, extending overall asset life. Less catastrophic failure means fewer unsafe conditions for on-site technicians and the public.
Predictive alerts also give teams time to plan safe repairs rather than work under pressure. Over time, data-driven insights reveal operating regimes that shorten life, enabling policy or design changes that improve reliability across the fleet.
What Business KPIs Change First
Organizations track operational reliability metrics such as mean time between failures (MTBF), mean time to repair (MTTR), unplanned downtime, and the ratio of reactive to planned maintenance work. These metrics often improve first because they are directly tied to maintenance execution and asset reliability.
As maintenance processes mature, organizations typically see improvements in uptime, asset availability, and overall equipment effectiveness (OEE). Financial KPIs tend to follow as operational gains compound over time, including maintenance cost per asset, spare parts inventory costs, cost of goods sold, and revenue lost to downtime.
Early gains are usually operational. Over time, organizations that standardize predictive maintenance workflows and Physical AI infrastructure across assets and sites can create strategic advantages through higher reliability, lower operational risk, and faster scaling of operational intelligence.
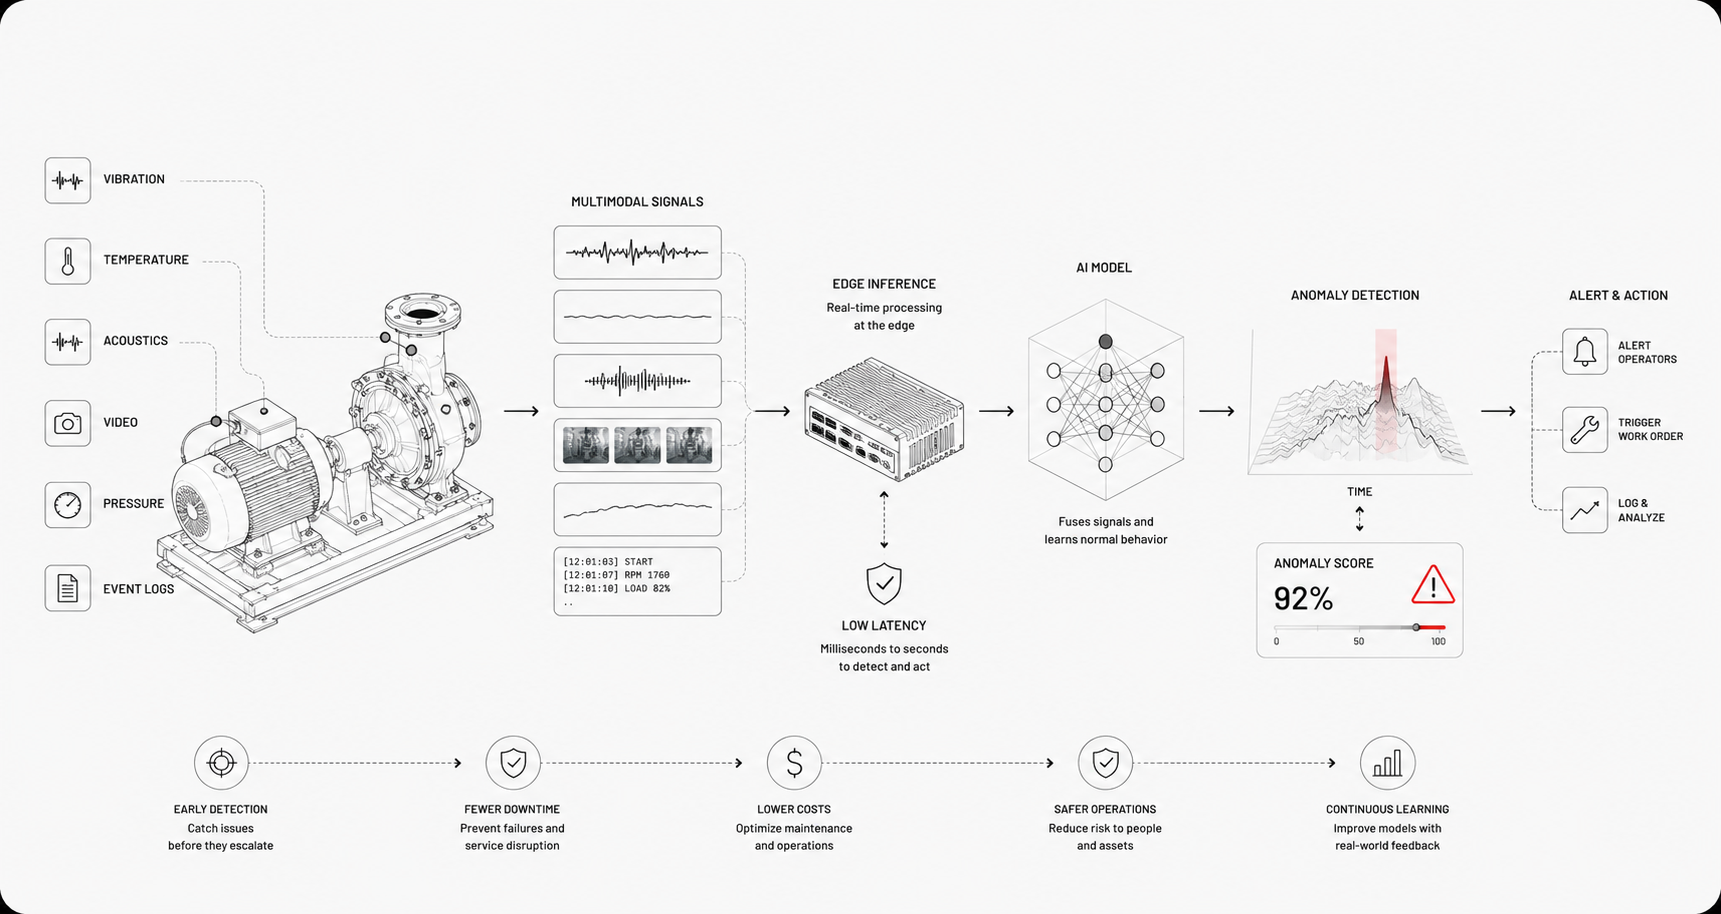
Which Data And Sensors Matter?
Which Sensor Types Provide The Best Signals
Modern industrial facilities already generate terabytes of sensor data daily — vibration patterns, thermal signatures, current draw, pressure readings, acoustic signals, video feeds, and system logs. Most of that data goes unused, not because it lacks value, but because traditional approaches can only act on one stream at a time.
The opportunity for predictive maintenance lies in the breadth of signals that already exist across the operation: time-series telemetry from equipment controllers, waveform data from accelerometers and current sensors, environmental readings from temperature and humidity probes, visual data from cameras and thermal imagers, and contextual information like operating state, shift schedules, and production phase.
The question is less about which single sensor type is "best" and more about which combination of signals captures the failure physics you care about. Foundation models for physical signals can fuse many of these modalities together, so teams don't have to choose a single stream or build separate pipelines for each one — they can start with whatever sensors are already deployed and layer in additional context over time.
How To Capture Telemetry And Event Data
Organizations can now capture raw waveforms when possible, not just derived metrics, because future models may require full signal fidelity to uncover patterns that engineered features miss. Time-synchronize every data stream to a common clock so events can be correlated across sensors and modalities. Record contextual metadata with each reading, including asset ID, operating state, load conditions, and environmental factors.
It’s recommended to log discrete events separately, for example alarms, work orders, and maintenance actions, and link them to telemetry via timestamps. Using edge preprocessing and aggregation helps reduce bandwidth while still preserving enough contextual data for diagnostics and model development. It’s also recommended to store both high-resolution, short-duration data and low-resolution, long-term histories for trend analysis.
How To Preprocess Signals And Remove Noise
Start by aligning and resampling sensor streams to a uniform rate, then remove obvious artifacts like sensor disconnects and saturations. Apply bandpass filters tuned to the component frequencies of interest, and use windowing to stabilize spectral estimates. Detrend slow drifts and normalize by operating point to separate load effects from wear.
Use statistical checks to drop or impute corrupt segments. Mark them as low confidence, and retain provenance. Extract features across both time and frequency domains, along with cross-sensor features such as coherence and correlation. Consistent, well-conditioned signals improve model stability, reduce false patterns, and accelerate iteration during development and deployment.
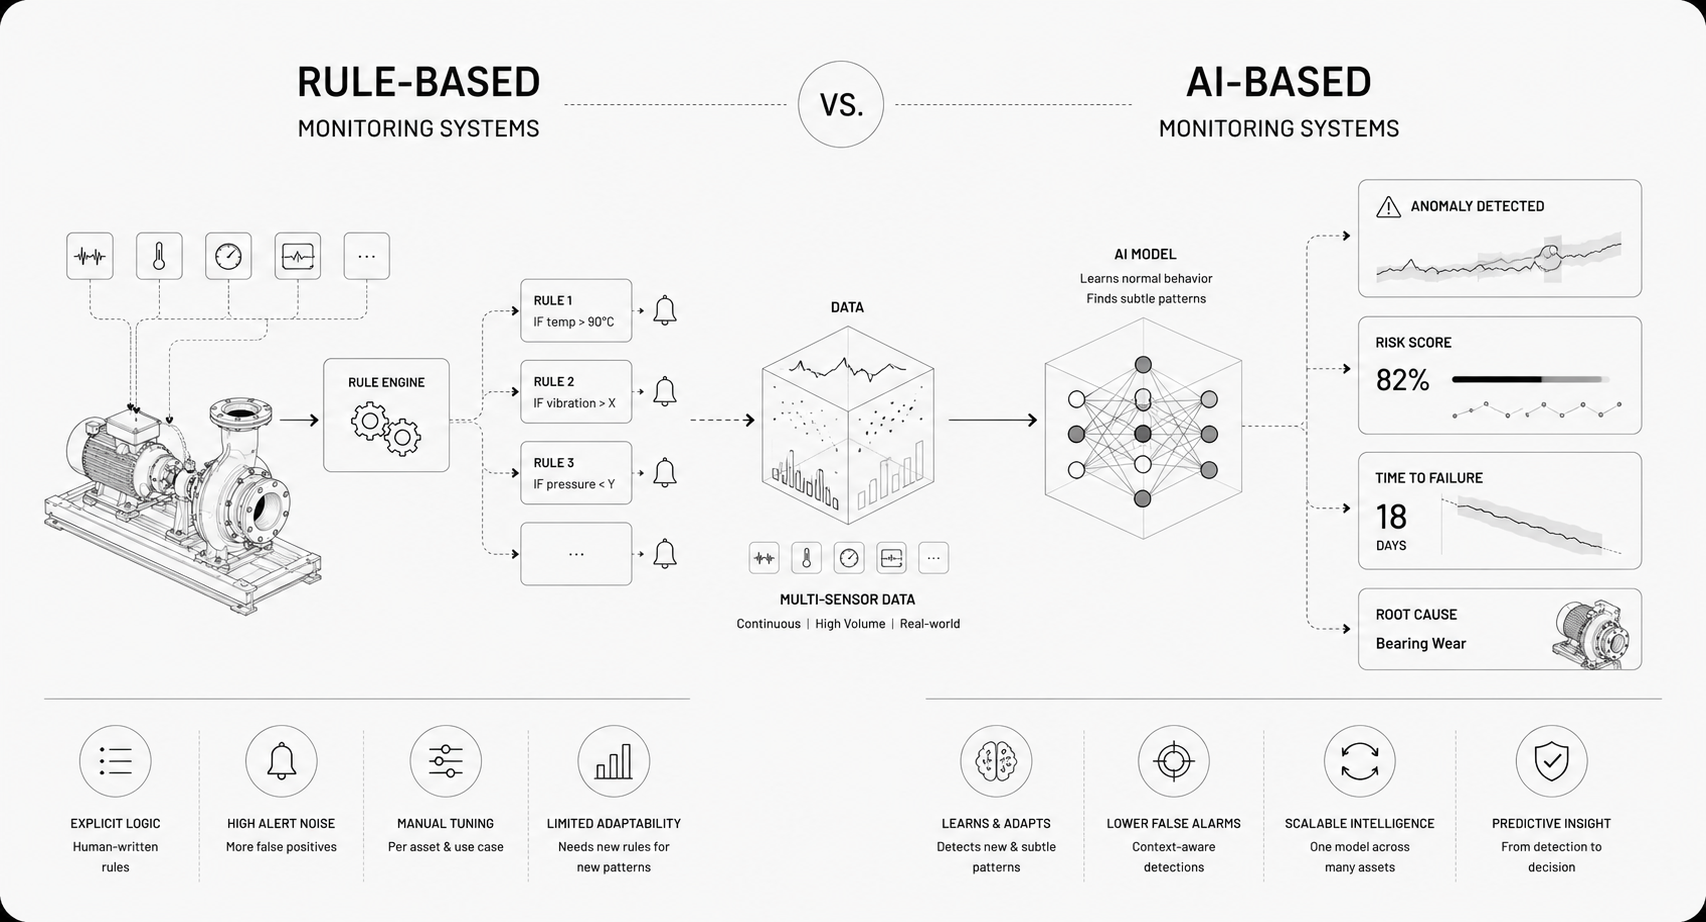
How Time Series And Anomaly Models Work
Forecasting models predict expected sensor behavior and then measure residuals. Large residuals can indicate emerging faults. Anomaly detectors build a model of normal behavior, whether through statistical envelopes, density estimation, or reconstruction error in autoencoders, and flag deviations.
Some pipelines combine both, using forecasts for seasonal trends and anomaly detectors for rare, abrupt events. Good systems estimate uncertainty, so alerts carry confidence levels, not just yes-or-no. In streaming environments, lightweight models detect change quickly, while heavier models run in batches for root cause analysis.
When To Use Deep Learning Versus Classical ML
Choose classical methods when data is limited, features are well understood, and interpretability matters. Random forests, gradient boosting, and SVMs work well on engineered features from FFT or envelope analysis. These approaches are efficient, easier to validate, and typically require less compute and less training data.
Use deep learning when you have large volumes of raw sensor data, complex cross-sensor interactions, or when you want models to learn representations automatically rather than relying on handcrafted features. Deep learning models excel with raw waveforms, spectrograms, and video, but they require more compute, larger datasets, and careful validation to avoid overfitting.
Foundation models for physical signals, like Newton from Archetype AI, can shift this balance because they provide pretrained representations that generalize across machines, conditions, and sensor types. Instead of building models for every asset from scratch, teams can adapt pretrained models to new equipment with a handful of representative examples using in-context learning. In practice, the right approach depends on data volume, latency needs, deployment constraints, and how much interpretability operators require from the system.
How To Deploy Models In Production?
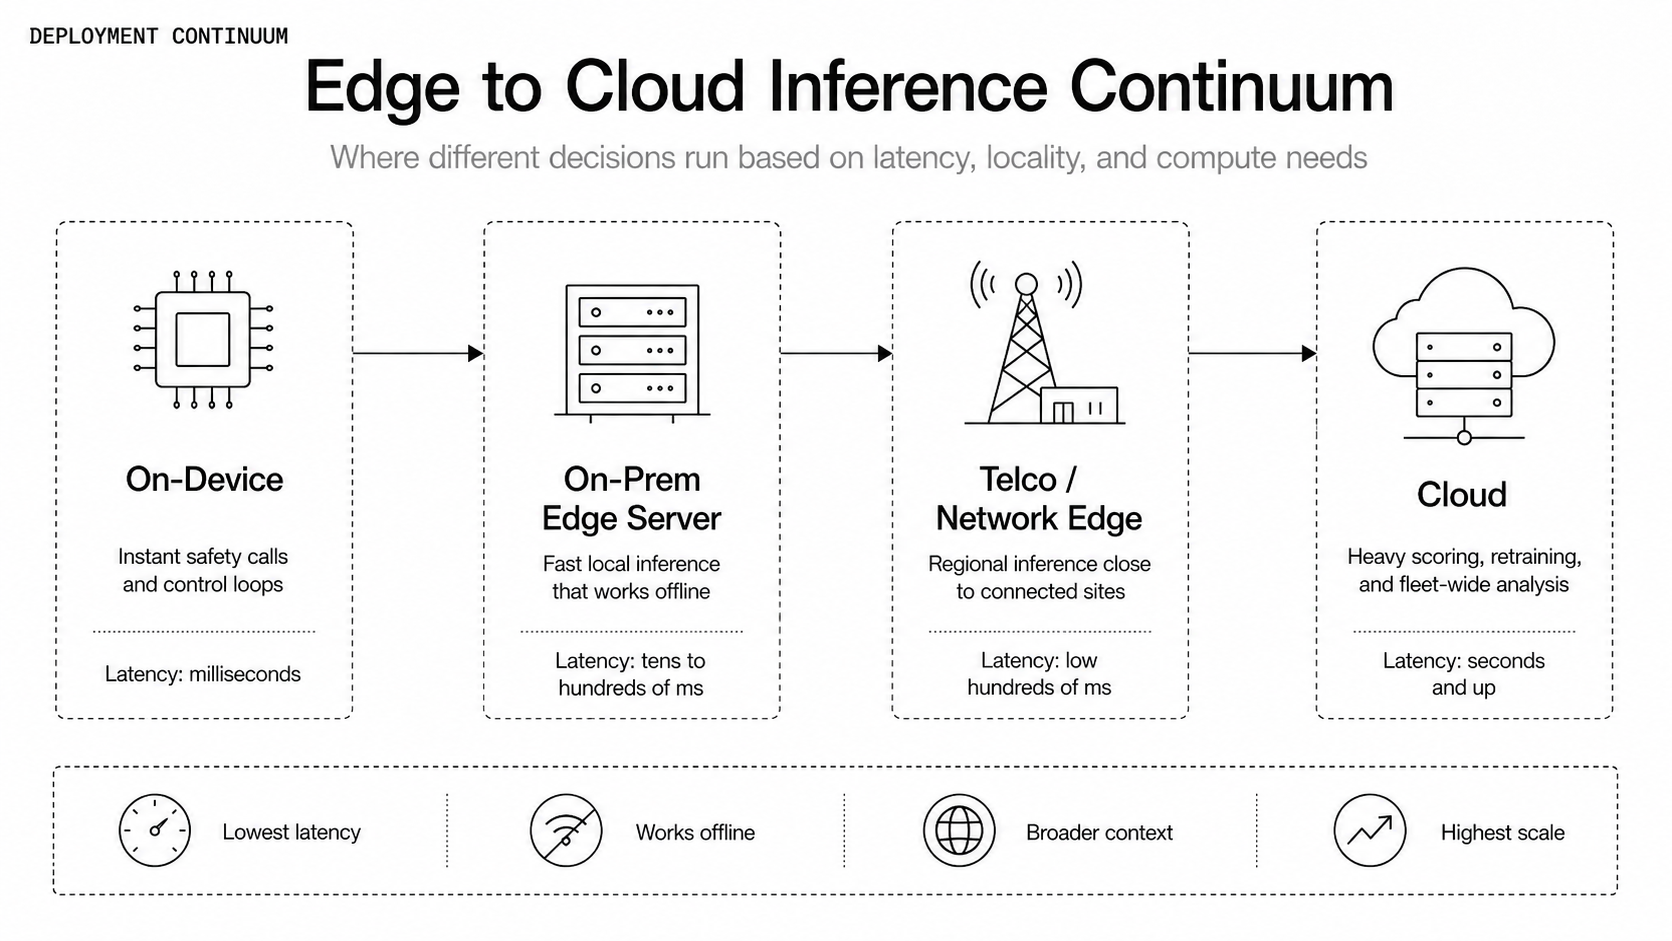
When To Run Inference At The Edge Versus Cloud
The edge is not a single place — it is a continuum that runs from on-device inference at the sensor itself to an on-premises edge server on the factory floor, to the telco edge and radio access network, and finally to the cloud. The practical question is rarely "edge or cloud" but where each individual decision needs to be made.
Decide with four lenses: latency, connectivity, data gravity, and model complexity.
- Latency. Run at the edge when a decision must be made in the moment — a safety intervention, autonomous control, or any real-time response. Latency budgets are tighter than teams expect: in real-world edge deployments, adding even tens of milliseconds of round-trip latency has been observed to degrade detection performance by double digits because, by the time a round trip to the cloud completes, the moment that mattered has already passed.
- Connectivity. Assume offline is the norm for critical assets. Field, underground, and remote installations lose connectivity, and an asset that cannot run inference when the link drops is not resilient. Local inference keeps operating through outages — define an explicit, safe default state for when connectivity breaks.
- Data gravity and cost. High-bandwidth sources like video and high-frequency vibration generate enormous volumes, and continuously streaming raw data to the cloud is expensive and ultimately bounded by physics — even the best fiber cannot move petabytes instantly. Run inference close to the data, then send only compressed "intelligence events," such as anomalies and summaries, upstream for retraining and fleet analysis.
- Model complexity and fleet context. Run in the cloud, or a private cloud, when models are large, require fleet-wide correlation, or need frequent retraining and centralized oversight.
Think in terms of the whole system, not a single location. A hybrid pattern usually wins: a small, fast model at the edge makes the time-critical call, while heavier scoring, model training, post-processing, and cross-fleet analysis live in the cloud. A safety decision may need to happen in milliseconds, but packaging up evidence and routing it to a downstream system can take seconds — different decisions belong at different layers.
How To Handle Streaming Versus Batch Scoring
Match scoring style to the decision you need to make and to how fresh the data must be. As a recent study of IoT predictive-maintenance pipelines notes, low-latency streaming is essential for the early detection of anomalies and timely failure prediction, because stale data can lead to missed failure indicators or unnecessary maintenance interventions.
- Real-time streaming: windowed features, stateful detection, and low-latency models. Use stream processors that support event-time handling and exactly-once semantics, and keep models small and deterministic.
- Near-real-time micro-batch: process short windows every few minutes — cheaper than strict streaming and simpler to debug. This is the dominant production pattern: a typical reference architecture takes a slice of streaming data each time (micro-batch) and processes it in fixed windows, for example 60-second windows, before generating inferences.
- Batch scoring: run daily or weekly for long-horizon risk, fleet comparisons, and scheduled planning. A production substation-monitoring system, for instance, runs its serving as a daily batch job that scores every asset and produces a scored list ranked by failure probability, often at multiple horizons such as 7, 14, and 30 days so crews can prioritize.
A unified engine that runs the same code across batch and streaming reduces the risk of training/serving skew. Whichever style you choose, design idempotent scoring, immutable outputs, and backfill processes to recompute scores when models or features change, and ensure feature computation is identical between training and serving.
How To Monitor Latency, Throughput, And Health
Treat serving like production infrastructure with SLOs and alarms. Production predictive-maintenance pipelines instrument both layers: monitoring should cover both infrastructure metrics (CPU utilization, memory consumption, network throughput) and application-specific metrics (model prediction accuracy, data processing latency, anomaly scores).
- Latency: track p50, p95, and p99 for inference and end-to-end scoring, and alert when p95 crosses thresholds that impact action timelines.
- Throughput: monitor requests per second, concurrency, and queue depth to spot bottlenecks before drops occur.
- Error rates: record failed inferences, model timeouts, and malformed inputs.
- Resource health: CPU, GPU utilization, memory, and disk I/O on edge and cloud nodes.
- Data freshness: lag between sensor time and ingestion, and feature staleness.
- Model health: prediction distribution shifts, sudden changes in confidence, and drift counters. In production, drift detection is what triggers retraining — not a calendar schedule, so instrument every serving run with feature distribution statistics, compare them to training-time distributions, and alert when drift exceeds thresholds.
Instrument dashboards (for example, Prometheus and Grafana), automated retries, circuit breakers, and canary rollouts for new models. Capture logs and sample inputs for debugging mispredictions.
How To Integrate With Maintenance Workflows?
How To Connect To CMMS And ERP Systems
Integration needs to be robust, auditable, and reversible. Decide which system owns each record — typically the ERP owns parts and suppliers while the CMMS owns work orders — and keep master asset data in one place, since duplicate records are the biggest drag on data accuracy.
- Map asset identifiers across model and CMMS/ERP, and maintain a master asset registry.
- Push predictions as structured work requests via the CMMS API, with confidence, recommended action, and supporting links.
- Reuse maintenance templates so predicted work becomes standard procedure.
- Sync closure events back to the model database to close the feedback loop.
- Add reconciliation rules to de-duplicate alerts that hit the same asset.
Keep integrations minimal at first: start with the single workflow that has the biggest impact on daily operations, prove measurable wins, then scale before expanding to BOMs, spare-part reservations, and procurement triggers.
How To Design Actionable Alerts And Playbooks
Design alerts to remove guesswork. Following the principle behind alarm rationalization, if an alert does not require a defined response, it should not exist: every alert should say what's wrong, what to do, how fast, and what happens if ignored.
- Attach a recommended action, priority, and lead time, plus context: recent trends, likely failure mode, signal snippets.
- Use tiered playbooks by confidence, and automate routine actions where safe.
- Track the true-to-false alarm ratio as a reliability metric, and refine steps that underperform.
Good playbooks cut cognitive load. But when low-value alerts pile up, crews tune them out and miss critical ones, so prune nuisance alerts as aggressively as you add them.
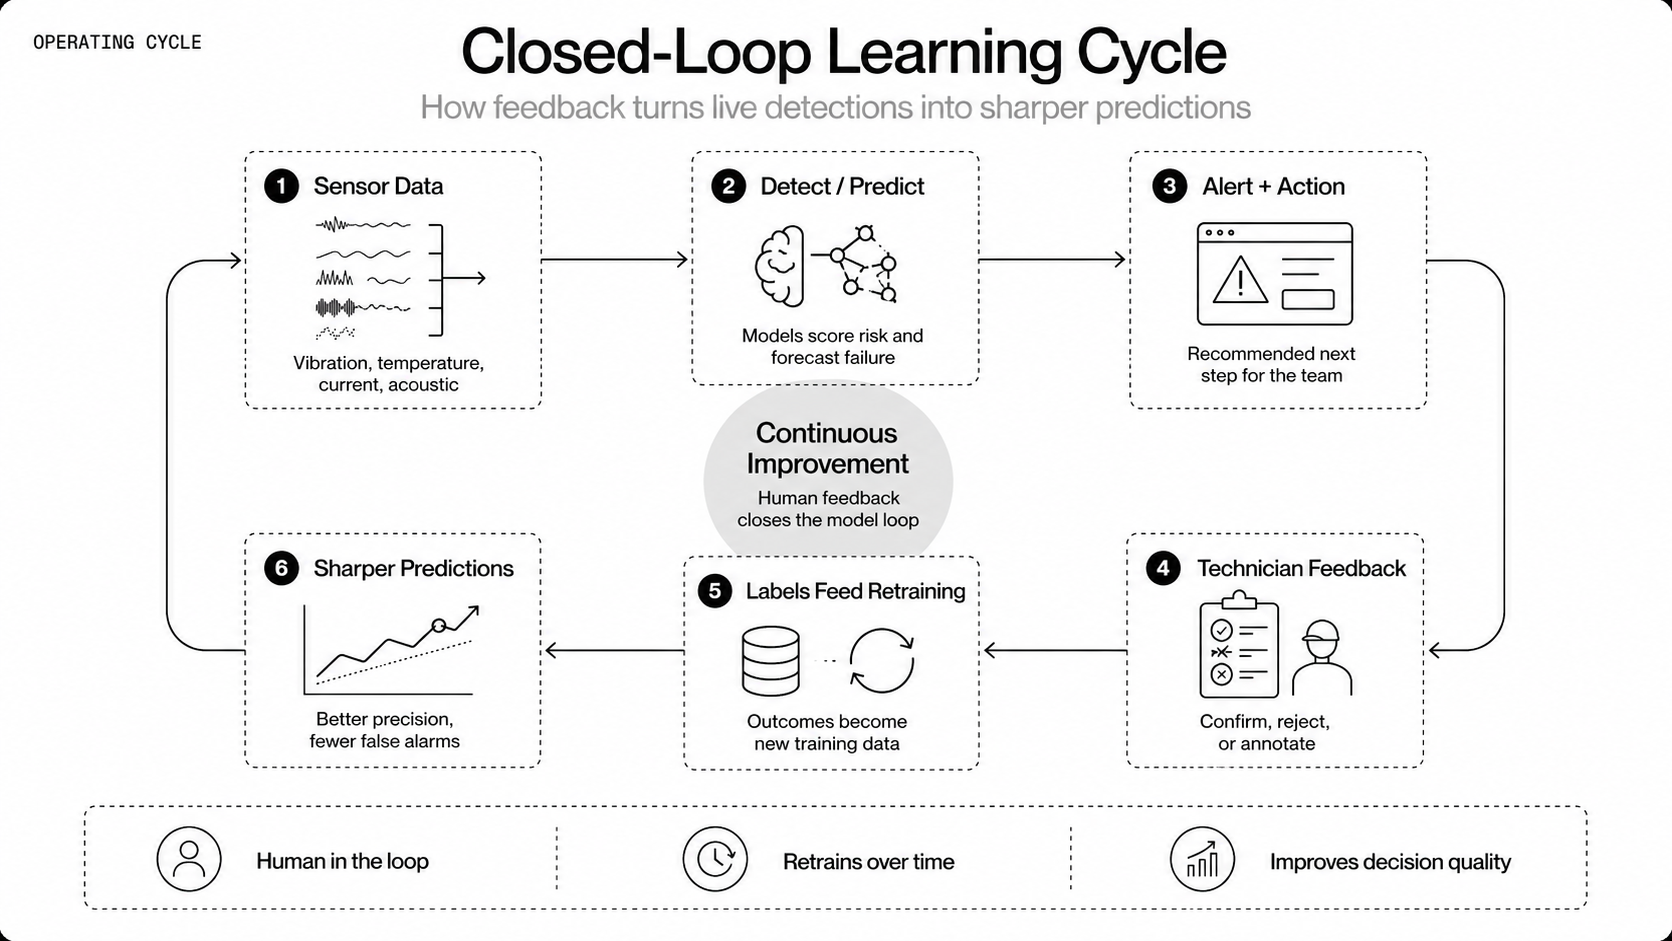
How To Enable Human In The Loop Decisions
Combine algorithmic speed with human judgment, and experienced technicians still catch what software misses — a change in sound, an odor, a vibration underfoot — and their review keeps a program trusted.
- Surface explanations and historical cases so technicians trust predictions, and route ambiguous cases to experts.
- Provide simple confirm/reject/annotate feedback, and feed those labels into retraining and active learning.
- Keep the field UX low-friction, because complex workflows kill adoption.
Human confirmation prevents costly mistakes and supplies the labeled outcomes models need to improve.
How To Measure Performance And ROI?
Which Metrics Track Model Accuracy And Utility
Pick metrics that reflect actionability, not just statistical fit.
- Precision and recall within a defined lead time, for example recall of failures predicted at least 24 hours ahead.
- False positives per asset per year, because operational cost scales with nuisance alarms.
- Lead time distribution, median advance warning, and tail percentiles.
- For RUL, use MAE and prediction interval coverage, plus calibration metrics like Brier score.
- Business-weighted metrics, for example cost-weighted error where false negatives carry higher penalty.
- Monitor drift metrics: feature distribution distance and change in base rates.
Tie these directly to downstream actions and work order outcomes to prove utility.
How To Quantify Cost Savings And Avoided Downtime
Translate predictions into dollar impact using simple, auditable calculations, then sanity-check them against published benchmarks. Mature predictive-maintenance programs typically raise equipment uptime 10–20%, cut maintenance costs 5–10%, and reduce maintenance-planning time 20–50%, set against unplanned downtime that costs industrial manufacturers an estimated $50 billion a year.
- Baseline: measure current downtime hours, mean time to repair, and cost per downtime hour.
- Avoided downtime value = predicted prevented downtime hours multiplied by cost per hour, adjusted by model precision (only count high-confidence true positives).
- Labor savings: estimate reduction in emergency dispatches and overtime.
- Avoided replacements: count the parts you don't swap — predictive maintenance also saves money by flagging when a healthy part should stay in service, not only by catching failures.
- Inventory benefits: lower spare-part holding costs through just-in-time replenishment.
- Use control groups or A/B tests during pilots to isolate the model effect, then extrapolate carefully when scaling.
Calculate payback period and net present value for the project to justify further investment, and benchmark against documented results — a single-asset-class pilot, for example, cut unplanned downtime 80% and saved roughly $300,000 per asset.
How Physical AI Platforms Change The ROI Math
Traditional ROI models assume one model per asset or use case, each with its own build, validation, and upkeep cost. A Physical AI platform like Archetype changes that math, because a single pretrained foundation model generalizes across assets, sensors, and sites. Extending a proven deployment from one machine to a whole fleet shifts from a multi-month modeling project per asset toward something closer to a same-week configuration — so each new use case is cheaper than the last, and value scales faster than cost.
- Reuse and portability: one model serves many assets, OEMs, and operating conditions, so a success at one site transfers instead of being rebuilt from scratch.
- Time-to-value: out-of-the-box performance lets pilots run without months of custom training or labeling, shortening payback.
- Lower run cost: running inference at the edge or on-prem avoids continuously streaming raw, high-bandwidth data such as video and high-frequency vibration to the cloud, cutting transport and compute spend.
When you model ROI for a platform like Archetype, count these portfolio effects, not just the savings from a single avoided failure. A wind-turbine deployment where multimodal monitoring surfaced nine previously unknown failure patterns, with an estimated $50 million in annual downtime impact, is the kind of upside a single-signal point solution would miss.
Which Leading Indicators Prove Business Impact
Leading indicators tell you whether the program is on track before full ROI materializes.
- Percent of work that is planned versus reactive, trending up as predictions are acted on.
- Warning-to-failure ratio, indicating whether alerts provide useful lead time rather than noise.
- Time from alert to action, and percent of alerts closed as true positives by technicians.
- Instrumentation coverage and data completeness, because you cannot predict what you do not observe.
- Model coverage: percent of fleet with production models and percent passing health checks.
- Reduction in emergency truck rolls and improved schedule utilization for crews.
These signals let you course-correct early, scale with confidence, and show stakeholders progress long before financials fully materialize.
Which Tools And Platforms To Use?
What Commercial Solutions Are Available
Commercial offerings fall into clear categories. Pick based on scope and team skills. Turnkey predictive maintenance platforms provide end-to-end stacks, from ingestion to alerts, and are fastest to pilot, but can lock you into their feature set. Industrial IoT platforms focus on device fleets, edge management, and secure telemetry. They simplify device lifecycle and scale.
Cloud ML suites offer managed training, feature stores, and model hosting, which is useful when you want centralized fleet learning and elastic compute. CMMS/ERP-integrated vendors turn predictions directly into work orders, reducing integration work. Edge inference appliances and industrial gateways provide hardened, low-latency serving for sites with poor connectivity. Choose a mix that matches your bandwidth, latency, and integration needs, not a one-size-fits-all vendor. Prioritize openness: APIs, exportable models, and clear data ownership, so you can swap components as the program matures.
A newer category — full-stack Physical AI platforms — combines a foundation model for physical signals with domain-specific solution tools and deployment flexibility across cloud, VPC, on-premises, and edge infrastructure. These products (for example, Archetype Platform) let teams build predictive maintenance agents on top of pre-trained sensor intelligence rather than training from scratch, collapsing months of custom ML work into days of configuration.
How NVIDIA And GPU Platforms Accelerate Models
GPUs speed up both training and inference for large models that consume raw waveforms, spectrograms, or video. They cut iteration time from days to hours, letting teams try architectures and hyperparameters quickly. For edge and on-premises inference, GPU-accelerated appliances handle heavier convolutional and transformer models with predictable latency.
GPU platforms also enable transfer learning and foundation-model fine-tuning, which matters when you want to leverage broad physical priors rather than build from scratch. That said, not every pipeline needs GPUs: classical feature-based models run fine on CPU, and lightweight edge models should prioritize deterministic performance and low power. Use GPUs where model complexity and data volume deliver materially better predictive power.
What Industry Use Cases Work Best?
How Manufacturing Uses Predictive Models
Manufacturing is the classic fit because assets are numerous, repeatable, and well instrumented. Predictive models focus on motors, gearboxes, spindles, and conveyors, spotting bearing wear, imbalance, and lubrication issues early. Results are rapid: fewer line stoppages, more predictable changeovers, and optimized spare-part inventories.
Physical AI lets teams scale learnings from one line to many, because the same failure physics repeat across similar assets. The same monitoring approach extends well beyond rotating equipment, fusing signals like temperature and even video to evaluate HVAC systems, process lines, and facility equipment, not just motors and bearings.
In one deployment, Archetype's process monitoring agent analyzed data from more than 40 sensors on complex wind turbines and discovered nine previously unknown failure patterns — patterns that even industry experts were not aware of — with more than $50 million in estimated annual downtime impact. That kind of multimodal, cross-sensor insight is what distinguishes foundation-model approaches from traditional single-signal monitoring. Early mover plants standardize sensors and model interfaces, then treat models as shared assets for faster rollouts.
How Energy And Utilities Apply Monitoring
Energy systems are high value and safety critical, so monitoring targets transformers, turbines, pumps, and grid assets. Predictive models detect insulation breakdown, cavitation, and bearing degradation, and they feed into scheduling for outages and inspections. Utilities use predictive alerts to prioritize field crews, reduce emergency outages, and comply with availability targets. The sector benefits from cross-site learning, since many degradation modes are physically similar across substations and plants, letting foundation-model approaches lift accuracy with fewer local failures.
Upstream oil and gas is an especially strong fit: rigs and wellsites stream continuous data on torque, weight on bit, rate of penetration, standpipe pressure, vibration, temperature, flow, current, and acoustics, and the precursors of stuck pipe, kicks, sand erosion, gas locks, and rotating-equipment faults are present in that data but buried in noise. A foundation model fuses these signals to identify operational states automatically and catch degradation early, supporting use cases from drilling-state detection and submersible-pump health to sand-erosion, corrosion, and multiphase-flow monitoring. Because critical failures may occur only once or twice a year across an entire fleet, traditional ML rarely has enough labeled examples — so generalization from a pretrained model matters most exactly where labels are scarcest.
The Archetype Platform organizes these capabilities into three categories — machine intelligence, process intelligence, workforce intelligence — with Physical AI agents deployable in the cloud, on-premises, or at the edge to meet the latency and data-sovereignty requirements that energy and utility environments demand.
How Transportation And Logistics Reduce Failures
Transportation assets, from rail cars to delivery fleets, are distributed and operate under varied conditions. Predictive maintenance reduces roadside failures and unscheduled downtime by flagging drivetrain, brake, and battery degradation. For logistics, fewer breakdowns mean more reliable schedules and lower penalty costs.
Telematics, vibration, and temperature data combine to produce actionable lead times, and fleet-wide models spot systemic issues like a bad parts batch or a firmware regression. Inside distribution centers, the same approach watches high-throughput sortation and conveyor systems: maintenance windows are often limited to a few hours a day, so an unplanned stoppage backs up packages fast, and models that flag degradation between windows directly protect throughput.
Short Case Studies And Example Outcomes
Physical AI platforms are the next step in predictive maintenance, which is why the examples below focus on the Archetype Platform and its Newton foundation model — showing how this approach delivers these predictive-maintenance use cases in practice.
- Wind turbines (energy): Running out of the box, Newton's process-monitoring agent fused more than 40 sensors on complex turbines and surfaced nine previously unknown failure patterns — modes even industry experts had not catalogued — representing an estimated $50 million-plus in annual downtime impact.
- HVAC systems: Benchmarked head-to-head against software purpose-built for HVAC, out-of-the-box Newton outperformed it, flagging faults such as a stuck cooling valve, a stuck damper, or a filter restriction as deviations from normal operation.
- Data center operations: By fusing temperature readings with video, Newton recognized that a temperature drop coincided with a person walking through and opening a door — telling a benign event apart from a true anomaly in a way single-signal monitoring cannot.
- Factory-floor machinery: Connected directly to machines on the floor, Newton identified issues immediately, with no months of custom model training or development beforehand.
- Construction: Newton combined site video with weather and tidal data to track equipment and worker utilization, improving productivity and helping avoid project cost overruns.
- Upstream oil & gas: On rigs and producing wells, the platform can identify operational states automatically — reducing Invisible Lost Time and non-productive time — and run a containerized pump agent that separates normal operation from a blocked intake, with the same model extending to sand-erosion, corrosion, and rotating-equipment monitoring.
What Risks And Compliance To Address?
How To Secure Sensor And Model Data
Protect telemetry and model artifacts with layered controls.
- Encrypt data both in transit and at rest, and use authenticated device identities to prevent spoofed sensors.
- Implement role-based access controls and least-privilege for data and model repositories.
- Segment networks so operational control systems are separated from general IT, and log all access to sensor streams and model endpoints for audit.
- Preserve provenance, firmware versions, and calibration records with each data point to support investigations.
Also consider privacy and commercial sensitivity, location data, and asset identity. Treat sensor metadata as business-critical and protect it accordingly.
How To Ensure Safety And Regulatory Compliance
Align predictive systems with operational safety processes, not instead of them.
- Validate models against safety cases and existing standards relevant to your industry, for example functional safety frameworks in industrial and automotive domains.
- Keep human-in-loop gates for safety-critical actions, and use conservative thresholds during the initial deployment phase.
- Document validation protocols, test coverage, and model limits so auditors and safety engineers can reproduce results.
- Retain audit trails for all alerts and technician actions, including timestamps, evidence, and decisions, to support compliance reviews and incident investigations.
Regulators will expect traceability from sensor to decision, so build that traceability upfront.
How To Mitigate False Alarms And Liability
False alarms erode trust and create real costs — liability, too. Left unchecked, nuisance alerts condition crews to treat alarms as background noise, so manage alarm quality as deliberately as model accuracy.
- Design alerts with tiered confidence: low-confidence flags for investigation, high-confidence for mandatory actions.
- Require multi-sensor corroboration or secondary checks for high-cost interventions.
- Calibrate models using business-weighted loss functions so you optimize the operational trade-off between false positives and false negatives.
- Maintain transparent documentation and disclaimers about model limits, and route critical decisions through accountable roles.
- Run A/B or controlled rollouts to quantify operational impact and calibrate thresholds before broad adoption.
Finally, keep legal and insurance teams in the loop. Clear SLAs and auditable decisions reduce organizational exposure and help operational teams act without fear of undue liability.
Common Mistakes And How To Avoid Them
Why Poor Data Planning Fails Projects
Teams assume more data fixes everything, then discover a flood of useless streams. Sensor choice matters more than quantity, because the wrong modality or sampling rate produces signals that never correlate with failure physics. Common failures are simple and predictable: unsynced clocks that break cross-sensor correlation, missing metadata that makes asset mapping impossible, and retention policies that delete the only failure examples you later need for training.
How to avoid it:
- Start with failure physics, pick the minimal sensor set that captures the dominant mechanism. Less is easier to manage and cheaper to scale.
- Time sync every stream and record asset state metadata on ingestion. If you can’t correlate by timestamp, you can’t learn cause and effect.
- Define data contracts up front: formats, sampling rates, retention, and ownership. Automate checks that enforce them.
- Run a short collection window and validate quality before investing further. Check completeness, range, and coherence across modalities.
- Preserve raw waveforms and provenance, even if you store lower-resolution summaries for long-term retention. Future models will want the high-fidelity data you didn’t think you’d need.
Remember, the physical world generates trillions of sensor signals and most teams barely scrape the surface. Good data planning turns that potential into reliable input for models, not noise.
As NTT DATA's Physical AI practice has observed in manufacturing engagements, having lots of data does not equal having AI-ready data — a historian full of sensor logs is not the same as a pipeline a model can actively consume. The transition to Physical AI requires a mindset shift across the organization, not just a technology upgrade.
Why Ignoring Integration Kills Adoption
A model that lives on a dashboard but never changes a work order is just a curiosity. Adoption fails when predictions don’t map cleanly into existing maintenance workflows, or when alerts are hard to trust and act on.
Common integration mistakes:
- No asset id mapping between model outputs and the CMMS, causing ambiguous tickets.
- Alerts without clear recommended actions or playbooks, leaving technicians unsure what to do.
- Lack of feedback path, so closed work orders never return as labels for model improvement.
- Too many low-confidence alerts, which trains crews to ignore the system.
Fixes that work:
- Map asset identifiers and normalize naming before pilot start. Maintain a master asset registry.
- Convert high-confidence predictions into templated work requests with required fields: priority, recommended action, confidence, and supporting evidence.
- Start in shadow mode, then route only high-confidence alerts to a dedicated squad with explicit playbooks.
- Build the feedback loop from day one, so technician confirmations, rejections, and closures become training labels.
Integration is not optional. The shift from reactive monitoring to predictive physical intelligence only sticks when predictions plug into day-to-day operations.
How To Avoid Overfitting And Unrealistic Expectations
Overfitting creeps in when teams reward headline accuracy on historical logs and ignore how models behave on new assets and operating regimes; unrealistic expectations follow from promising near-zero downtime while ignoring sensor blind spots, shifting operations, and label scarcity.
Defend against both: validate by time and by asset on holdout sets that mimic future deployment, keep simple baselines worth beating, calibrate uncertainty and show confidence intervals instead of single-point predictions, and penalize business-weighted errors so you optimize the cost operations actually cares about. Above all, limit scope and promises — set pilot success criteria that are operationally meaningful and benchmarked to realistic gains, like reducing emergency truck rolls by X percent, not eliminating all failures.
Foundation models for physical signals reduce sample requirements and can lower overfitting risk, because they bring broader priors about how the world moves. Newton, for example, is trained self-supervised on hundreds of millions of real-world sensor measurements, so it generalizes across machines, sensor types, and domains without per-asset labels — reducing annotation work that used to take months to configuration that can happen in days through natural-language prompts and n-shot examples. The teams building Physical AI infrastructure now will have an advantage, because they can iterate faster and generalize better without overfitting to one plant.
FAQs
What Are Examples Of AI Predictive Maintenance?
- Rotating equipment: using vibration and current to predict bearing or gearbox failures.
- Electrical systems: thermal and current profiling to catch insulation breakdowns or overloads.
- Pumps and valves: pressure, flow, and acoustic signatures that expose cavitation or seal wear.
- Fleet assets: telematics, temperature, and battery current to predict drivetrain or battery failures.
- Infrastructure: bridge strain, crack acoustic signals, and thermal anomalies in smart cities to prioritize inspections.
Which Software Supports Predictive Maintenance?
Think in categories, not brands.
- Turnkey predictive maintenance platforms for fast pilots and end-to-end flows.
- Industrial IoT stacks for device lifecycle, edge management, and secure telemetry.
- Cloud ML suites and feature stores for fleet-wide learning and retraining.
- CMMS/ERP connectors to convert predictions into work orders.
- Edge inference runtimes and appliances for low-latency, on-site scoring.
For prototyping, open-source frameworks like PyTorch, TensorFlow, and time-series toolkits are common. Foundation-model embeddings for physical signals can accelerate projects by reducing custom training work.
Full-stack Physical AI platforms like Archetype provide a foundation model (Newton), domain-specific solution tools, and deployment options across cloud, on-premises, and edge — letting teams move from pilot to production without rebuilding the stack for each use case.
How Is AI Used In Manufacturing Predictive Maintenance?
- Instrument critical assets with the right sensors and capture operating state.
- Build baselines of normal behavior, then detect deviations with forecasting or anomaly models.
- Use classifiers or RUL regressors when labeled failures exist.
- Route high-confidence alerts into planned maintenance windows, and low-confidence cases into investigative workflows.
- Feed technician outcomes back into the model to improve accuracy.
Manufacturing benefits from repeatability: the same failure physics recur across similar machines, so validated models transfer well once you standardize sensors and data schemas.
How Do I Start A Predictive Maintenance Project For My Facility?
Start narrow and prove value fast:
- Pick one measurable use case — a single asset class with frequent, costly failures — and baseline today's downtime, MTTR, and reactive-work ratio.
- Use the sensors you already have, validate signal quality, and run a time-boxed pilot in shadow mode.
- Measure precision and lead time, route only high-confidence alerts to a small trained squad, then scale to more assets once ROI is proven.
With the Archetype Platform, those steps compress. Newton connects to your existing sensors infrastructure, so there's no need to re-instrument or standardize hardware first. You define a use case in natural language with a handful of in-context examples and run out of the box — zero- or few-shot — rather than training a separate model per asset over months. Deploy wherever data and latency demand: in the cloud, inside your own VPC (including SageMaker or SAP), or on-premises and at the edge as a self-contained container on existing gateway hardware, with data residency staying entirely with you. Prove it on one asset, then extend the same model across the use cases and sites.