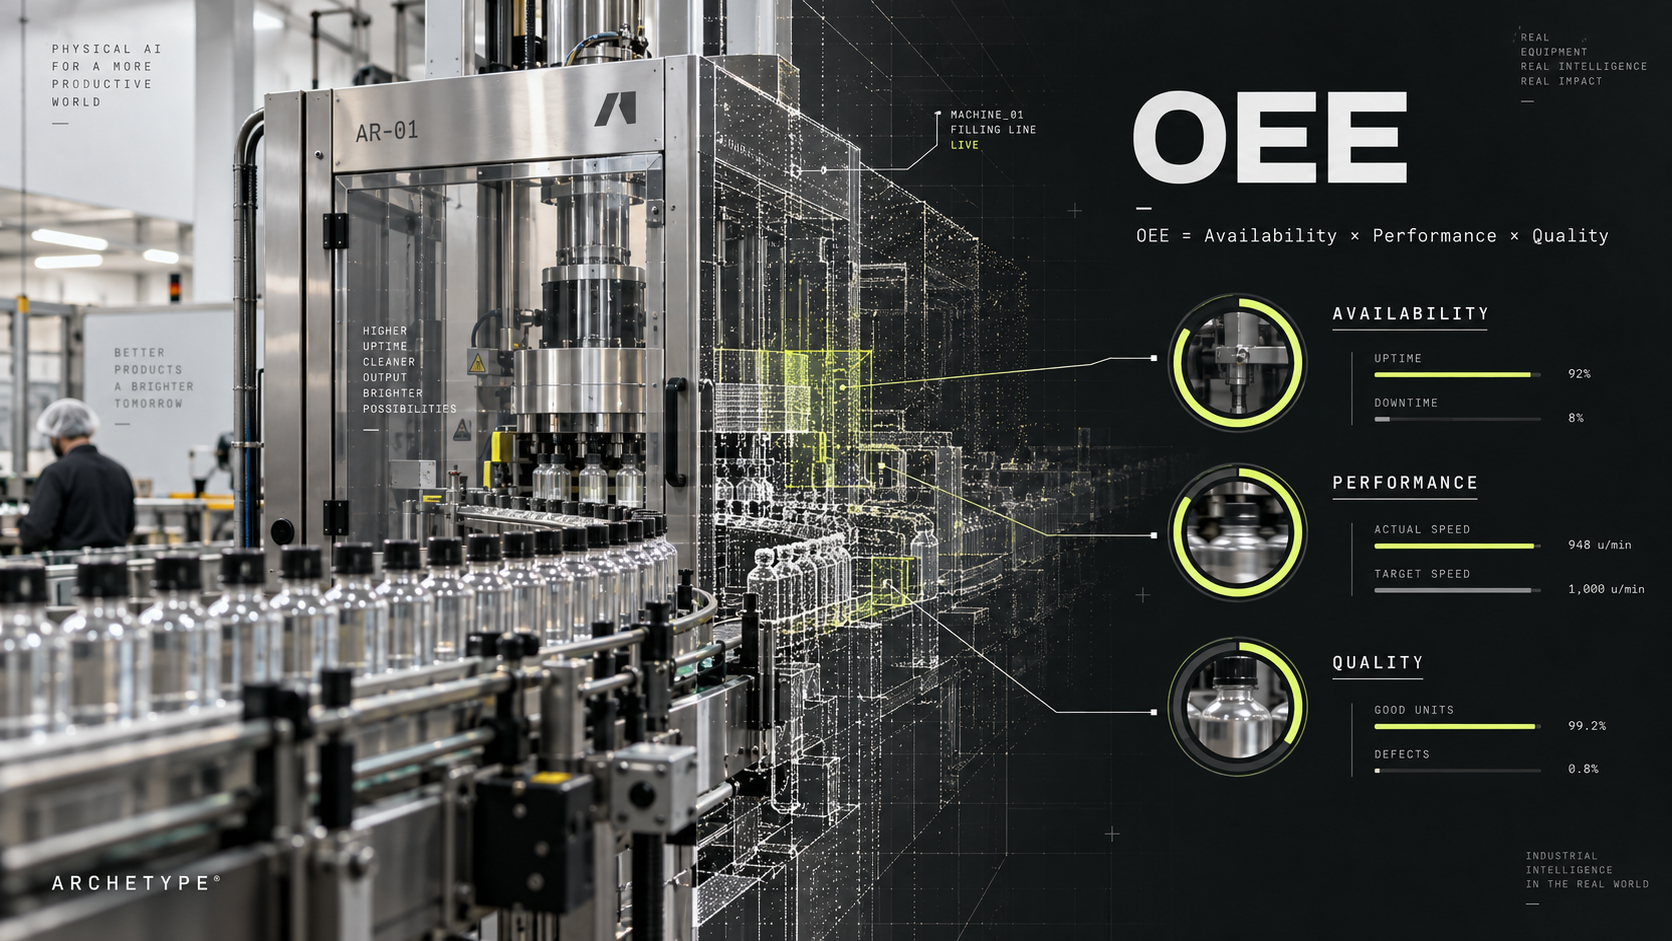
What Is Overall Equipment Effectiveness (OEE)?
Overall Equipment Effectiveness is a single percentage that tells you how much of your planned production time is genuinely productive. It combines three factors into one number: Availability (is the machine running when it should be), Performance (is it running at its designed speed), and Quality (is it making good parts the first time). Multiply the three and you get OEE. A line that is available 90% of the time, running at 95% of rated speed, and producing 99% good parts scores about 85%.
The metric comes from Total Productive Maintenance. Seiichi Nakajima formalized OEE in his TPM work in the 1980s as a way to expose the hidden losses that plant reports usually miss, and the international KPI standard ISO 22400 later codified the same factors. Its value is diagnostic rather than cosmetic. A utilization number can look healthy while a machine quietly bleeds capacity through short stops, slow cycles, and scrap. OEE forces those losses into the open, and because it is multiplicative, it refuses to let a strong factor hide a weak one.
That structure is also where the misconceptions start. OEE is not a productivity target to be maximized at any cost, and a high score on one asset says little about the plant as a whole. It works best as a trend and a decomposition, not a leaderboard. Deloitte estimates that poor maintenance strategies alone can cut a plant's overall productive capacity by 5 to 20 percent, and OEE is the metric that makes that loss visible before it reaches the income statement. It is one measure inside a broader asset performance management program, but usually the first one a plant reaches for.
How Do You Calculate OEE?
OEE is the product of three ratios, each measured against a clear baseline.
Availability is run time divided by planned production time. If a shift schedules 480 minutes and the machine runs for 400, availability is 83%. Planned maintenance and unscheduled breaks both count against it, though many teams separate the two so they can act on them differently.
Performance is actual output divided by the output the machine should have produced at its ideal cycle time during that run time. If ideal cycle time is 30 seconds and 400 minutes of run time yields 700 parts against a theoretical 800, performance is about 88%. This is the factor teams most often flatter, because an inflated ideal cycle time quietly hides speed loss.
Quality is good parts divided by total parts produced. Five hundred units with 15 rejects gives 97%.
Combine the three: 0.83 × 0.88 × 0.97 gives an OEE of roughly 71%. The number itself matters less than the breakdown behind it. A 71% score becomes far more useful once you know availability is the weak factor, because that points maintenance strategy at unplanned downtime rather than sending the process team chasing cycle time. The most common calculation error is using an optimistic ideal cycle time or excluding losses that should count, both of which produce a comfortable score that describes a plant nobody actually runs.
What Are the Six Big Losses?
Nakajima grouped the causes of lost effectiveness into six categories that map directly onto the three OEE factors. They turn a low score into a diagnosis instead of a verdict.
Availability losses are the first two: unplanned stops such as breakdowns and failures, and planned stops such as setups and changeovers. Performance losses are the next two: minor stops and idling, and reduced speed where the machine runs below its rated cycle. Quality losses are the last two: production rejects during stable running, and startup rejects produced while a process stabilizes after a stop.
Identifying which losses dominate is the entire point of the exercise. Two plants can post the same 65% OEE for completely different reasons, one drowning in changeover time and the other losing parts to a process that never settles. Automated data collection helps here, because losses recorded by hand are usually rounded, delayed, or quietly omitted. Once the losses are ranked, the improvement work becomes specific: the biggest category, on the most constrained asset, first.
What Counts as a Good OEE Score?
The widely cited benchmark for world-class OEE is 85%, the level Nakajima associated with mature TPM programs. It decomposes into roughly 90% Availability, 95% Performance, and 99.9% Quality. Those component targets are demanding on their own and rare in combination, which is why 85% is treated as excellent rather than merely good.
Typical performance sits well below that. Most discrete manufacturers are commonly cited as running somewhere between 40% and 60% OEE, and many are surprised by their first honest measurement. The gap is normal, not a failing. World-class thresholds also vary by production type: a high-volume line with few changeovers can realistically chase 85%, while a job shop running dozens of part numbers may run an efficient operation at 60%.
The practical move is to benchmark against yourself. An 85% target lifted from a textbook can mislead a plant whose product mix makes it unreachable, while a steady climb from 55% to 65% on a bottleneck asset is real money. For the availability half of that picture, reliability metrics such as mean time between failures sit underneath the OEE number and are worth tracking alongside it.
How Does OEE Fit into Lean Manufacturing and TPM?
OEE is the measurement layer that lean and TPM programs run on. Lean is concerned with eliminating waste, and the Six Big Losses are a precise inventory of the waste tied to equipment. TPM uses OEE to target its pillars, from autonomous maintenance to focused improvement, and to confirm that an intervention actually moved the number rather than just felt productive.
Used well, OEE connects daily maintenance and operations decisions to a shared score, which is what makes continuous improvement durable rather than episodic. The risk is treating the number as the goal. When OEE becomes a target people are measured against, the temptation to inflate ideal cycle times or reclassify downtime grows, and the metric loses the honesty that made it useful. The discipline lean asks for is to keep OEE as an instrument, read the losses under it, and act on the largest.
How Do You Improve Your OEE Score?
Improvement follows the losses, one factor at a time, starting with whichever is costing the most on the constraint.
Availability usually offers the largest early gains, and the main lever is maintenance strategy. Moving from reactive repair toward condition-based and predictive maintenance attacks unplanned stops directly, catching wear before it becomes a breakdown. Deloitte reports that predictive maintenance can raise equipment uptime and availability by 10 to 20 percent where it is applied well, which flows straight into the availability factor.
Performance gains come from attacking minor stops and speed loss, which means recording them accurately first and then standardizing the fastest safe cycle. Quality gains come from stabilizing the process and catching defects at the source rather than at final inspection, where inline inspection and vision systems increasingly do the early detection.
The measurement itself is now changing, and this is where Physical AI platforms are the next step. Newton, Archetype AI's physical world model, learns the normal behavior of a machine from its own sensor streams, including vibration, temperature, current, acoustics, and video, rather than from hand-set thresholds or a model built one asset at a time. That matters for OEE in two ways. It automates the loss data that manual collection gets wrong, and because it generalizes across equipment types from only a handful of examples, it can read a mixed fleet of assets instead of a single line. Running from cloud to edge, it can flag a developing availability loss in real time and name the condition behind it, so the improvement team acts on a cause rather than a symptom.
What Makes OEE Hard to Implement?
The most common failure is data. OEE is only as honest as the numbers feeding it, and manual collection tends to round short stops away, log downtime reasons inconsistently, and arrive too late to act on. A score built on bad data produces confident, wrong decisions.
The second challenge is cultural. OEE can feel like surveillance to the people on the line, and if it is used to rank operators rather than to find losses, it invites gaming instead of improvement. The third is time horizon. Real OEE gains come from sustained loss elimination, which competes with the short-term pressure to keep running at all costs. Handling all three means fixing measurement first, framing the metric as a tool for the team rather than a verdict on it, and protecting the improvement work from being the first thing cut when a schedule slips. Automated, sensor-based capture removes much of the data problem, which is often what unblocks the rest.
Where Is OEE Measurement Heading?
OEE started as a manual scorecard reviewed after the fact. It is becoming a real-time signal. Connected sensors and edge computing now let plants measure availability, performance, and quality continuously, turning OEE from a lagging report into a live diagnostic that flags a loss while there is still time to prevent it.
The larger shift is from measuring losses to explaining and anticipating them. Rule-based monitoring can tell you a machine stopped. Conventional per-asset models can sometimes predict that it will, but only after being trained on that specific machine's failure history. A physical world model changes those economics, because it learns the shared physics that governs how equipment behaves and carries that understanding to assets it has not seen before, adapting to each from a few examples rather than the labeled failure history most plants never accumulate. As those capabilities move to the edge and across mixed fleets, the practical result is OEE that is measured automatically, decomposed by cause, and read in real time, which is closer to what the metric was always meant to deliver.
Frequently Asked Questions
What is OEE and why is it important?
OEE measures how much of planned production time is truly productive, combining availability, performance, and quality into one percentage. It matters because it exposes losses that standard utilization or output numbers hide, and points improvement work at the specific factor costing the most.
How is OEE calculated?
OEE = Availability × Performance × Quality. Availability is run time over planned time, performance is actual output over the ideal output for that run time, and quality is good parts over total parts. Multiplying the three keeps a strong factor from masking a weak one.
What are the Six Big Losses?
Unplanned stops and planned stops (availability), minor stops and reduced speed (performance), and production rejects and startup rejects (quality). Each maps to one OEE factor, so ranking them tells you where to act.
What is a good OEE score?
85% is the widely cited world-class benchmark, built from roughly 90% availability, 95% performance, and 99.9% quality. Most plants run closer to 40 to 60 percent, and a realistic target depends on product mix and industry more than on any universal number.
How can I improve my OEE score?
Attack the largest loss on your most constrained asset first. Availability often responds fastest, through condition-based and predictive maintenance; performance through cutting minor stops and speed loss; quality through stabilizing the process and catching defects early.
How does OEE relate to lean manufacturing?
OEE is the score lean and TPM programs use to find and eliminate equipment waste. The Six Big Losses are an inventory of that waste, and OEE confirms whether an improvement actually worked, which keeps continuous improvement grounded in evidence.
