Equipment reliability is the probability that an asset performs its intended function, without failure, for a defined period under real operating conditions. It is not the same as availability or maintainability, and conflating the three is where most reliability programs go wrong. Reliability asks how often an asset fails. Availability asks how much of the time it is ready to run. Maintainability asks how quickly you can restore it after a stop. You can raise availability by getting very fast at repairs while equipment reliability quietly gets worse, which is a trap for teams that watch uptime alone. This guide covers how reliability is defined, the metrics that measure it, what failure actually costs, and the strategies that move the number.
What Does Equipment Reliability Actually Mean?
Reliability is a probability over time, measured under stated conditions. A pump that runs flawlessly in a lab but fails monthly in a slurry line is not reliable in the environment that matters. That context, meaning load, temperature, contamination, and duty cycle, is part of the definition, not a footnote.
The three terms teams blur together describe different things. Reliability is failure frequency: how long the asset runs before it breaks. Maintainability is recovery: how fast and how predictably you can bring it back. Availability is the outcome the plant feels, the share of scheduled time the asset is actually able to produce, and it depends on both of the other two. A machine can post high availability while being deeply unreliable, because if it fails often but gets repaired fast, the dashboard looks acceptable while repair labor, expedited parts, and lost throughput quietly accumulate. Sustained equipment uptime comes from improving reliability at the source, not from getting quicker at cleaning up after failures.
That distinction changes what a team should watch. Availability tells you where you stand today; reliability tells you what to expect tomorrow, which is why it sets the real floor under throughput, quality, and safety. Reliability also shifts across an asset's life. Many components follow a bathtub pattern: early failures from installation or manufacturing defects, a long stable middle, then a rising failure rate as wear accumulates. Knowing where an asset sits on that curve tells you whether the right move is commissioning discipline, steady-state monitoring, or planned replacement.
Which Metrics Measure Equipment Reliability?
Reliability is measured with a small set of metrics that most teams already track, though not always correctly. The core four:
- Mean Time Between Failures (MTBF) measures reliability directly. MTBF = total operating time / number of failures. A higher number means longer stretches of trouble-free running. It applies to repairable assets; for non-repairable parts, the equivalent is Mean Time To Failure (MTTF).
- Mean Time To Repair (MTTR) measures maintainability. MTTR = total repair time / number of repairs. It captures how quickly you recover, and it is the lever that improves availability without touching the underlying failure rate.
- Availability ties the two together. Availability = MTBF / (MTBF + MTTR). This is the number operations leaders feel, and it makes the reliability-versus-recovery trade explicit.
- Overall Equipment Effectiveness (OEE) is broader than reliability. OEE = availability × performance × quality. Only the availability term is reliability-driven; performance and quality capture speed losses and defects. Treat OEE as a productivity scorecard where reliability is one of three inputs, not as a pure reliability metric. The world-class OEE benchmark is widely cited at 85 percent, though most plants run well below it.
The limitation worth naming is that every one of these is a lagging indicator, computed from failures already recorded. MTBF trending down while availability holds steady means the team is compensating with faster repairs, a warning sign rather than a win. It also means a program built on these metrics alone reacts to history rather than to the degradation forming right now. Tracking failures by mode and by asset class matters more than a single plant-wide average, because a plant number hides the handful of bad actors that drive most of the loss.
What Does Equipment Failure Cost?
Equipment failure is expensive in ways that rarely show up on a single line of the P&L, and the direct repair is often the smallest part. According to Siemens' True Cost of Downtime 2024, unplanned downtime now costs the world's 500 largest companies about $1.4 trillion a year, equal to 11 percent of their combined revenue, up from 8 percent in 2019 and 2020. In automotive plants, Siemens puts the cost of stopped production at $2.3 million an hour.
Those figures capture the downstream reality: lost output, idle labor, expedited parts, scrapped in-process material, and the ripple through tightly sequenced supply chains, where a two-hour stop at one line delays several others. Unplanned failures also cost more per hour than planned work, because emergency repairs pull in overtime, expedited freight, and premium parts pricing that scheduled maintenance avoids. There are harder-to-count costs too. Repeated failures shorten asset life, inflate spare-parts inventory, and pull skilled people into firefighting instead of improvement work. Safety is the one that dwarfs the rest: catastrophic failures put people at risk, so a reliability program is also a safety program.
There is a hopeful signal in the same Siemens data. Incidents have grown less frequent even as each one costs more, which the report attributes to digitization and predictive maintenance taking hold. Reliability work pays, and the plants pulling ahead are the ones treating failure as preventable rather than inevitable.
How Do You Improve Equipment Reliability?
You improve reliability by moving effort upstream, from reactive repair toward strategies that catch degradation early and stop the same failure from recurring. Four practices carry most of the load.
Reliability-Centered Maintenance (RCM) is the organizing principle: it starts by asking what each asset is supposed to do and how it can fail to do it, then matches a maintenance tactic to each failure mode instead of applying one blanket schedule. Root-cause analysis closes the loop after failures, so a recurring bearing problem gets traced to misalignment or lubrication rather than repeatedly replaced. Standardizing procedures, from installation torque to lubrication routes, removes the variation that quietly seeds early failures. And moving from calendar-based to condition-based maintenance means acting on the asset's actual state rather than a fixed interval, so you neither over-service healthy equipment nor miss a machine degrading between service dates.
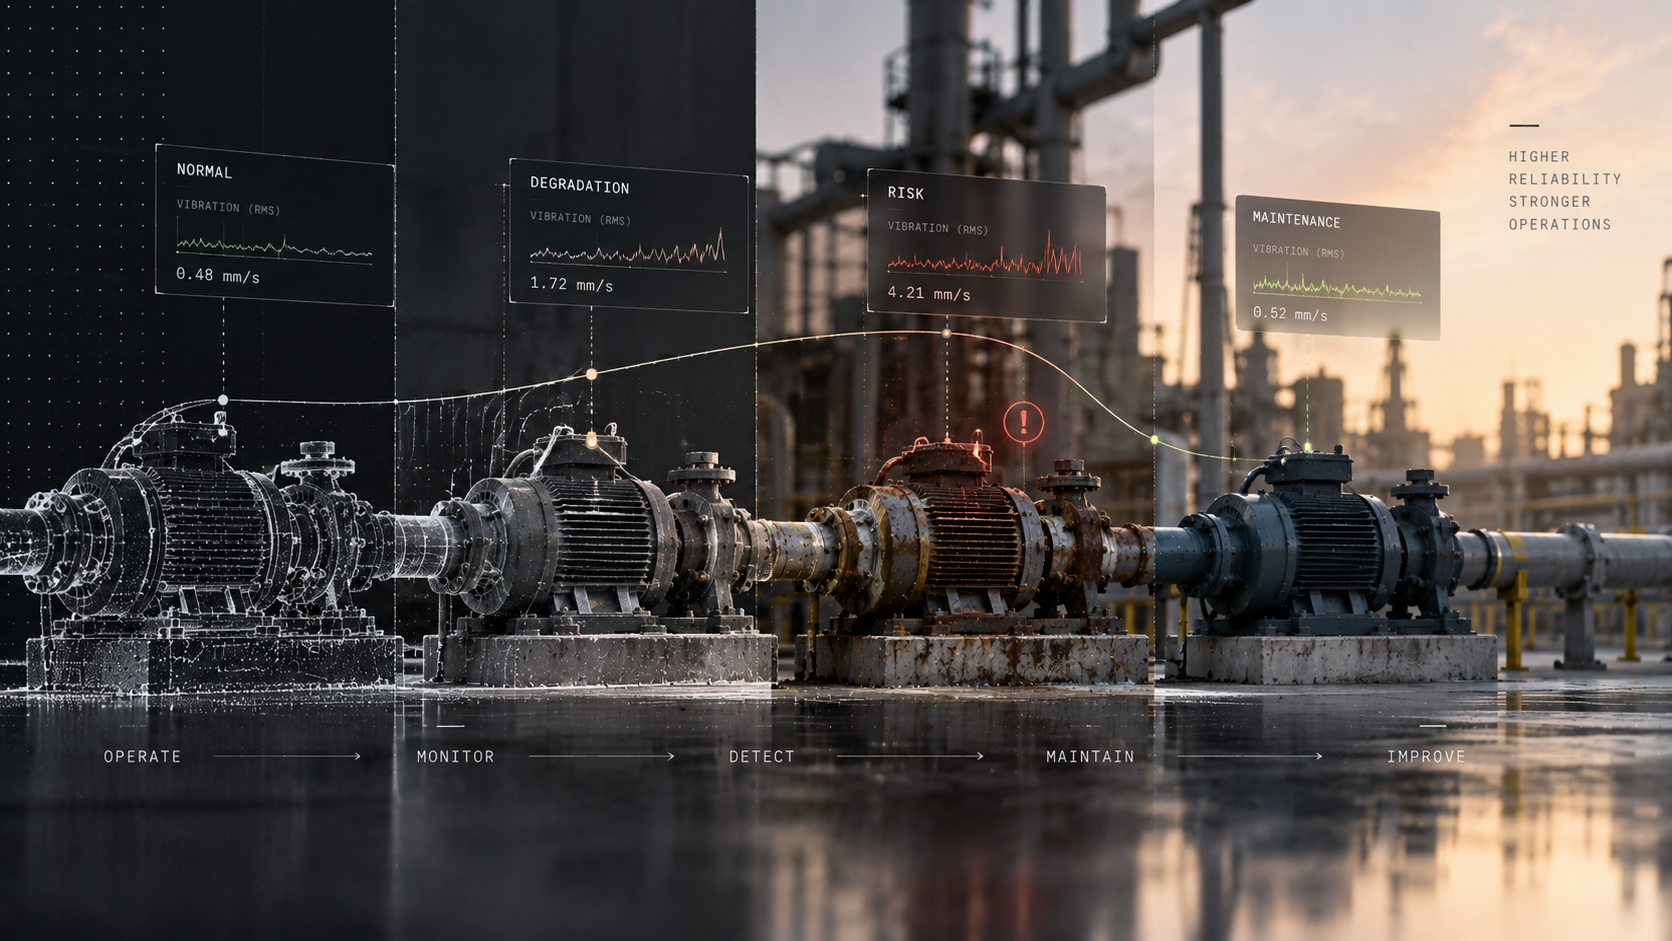
Targeting matters as much as method, because failures cluster. The biggest gain comes from catching degradation early, which is where predictive maintenance and, more broadly, asset performance management come in. Techniques like vibration analysis can flag a failing bearing weeks before it seizes, which matters because bearing faults are among the most common failure modes in rotating equipment: a 2025 review in MDPI Machines reports they account for nearly 40 percent of induction motor failures. A program that knows where failures concentrate can put its earliest, most sensitive monitoring exactly where the risk is, rather than spreading attention evenly across assets that fail in very different ways.
Physical AI platforms are the next step in this same progression. Traditional anomaly detection leans on fixed thresholds or a separate model built per machine, which is slow to deploy and brittle across a mixed fleet. A physical world model like Newton learns how equipment behaves directly from sensor data, including vibration, temperature, current, and acoustics, so it can recognize normal and abnormal states across many asset types, adapt to a new machine from as little as one labeled example, and run at the edge on modest hardware. That combination is what lets a reliability program reach beyond the few assets a hand-built model can cover.
How Do You Build a Reliability Program?
A reliability program starts with a baseline, not a purchase. Measure current MTBF, MTTR, and availability by asset class so you know where you stand and can prove movement later. Then rank assets by criticality, the combination of how likely each is to fail and how much a failure would cost in production, safety, and repair, because effort spread evenly across every machine is effort wasted. Most plants find that a small fraction of assets drives the majority of downtime.
For the critical few, identify the failure modes that actually occur and match a tactic to each: condition monitoring where degradation is detectable, redesign or standardization where the root cause is chronic, planned replacement where wear is predictable. Instrument those assets, set a monitoring approach that fits the failure physics, and close the loop with root-cause analysis after every significant event so the same failure does not recur. Finally, review the metrics on a fixed cadence. A reliability program is a habit, not a project, and the number moves only when the review keeps attention on the assets that matter.
Where Does Technology Fit in Reliability Engineering?
Technology's job in reliability is to see degradation coming and explain it in time to act. Condition monitoring instruments the asset with sensors for vibration, temperature, pressure, current, and acoustics, and streaming analytics turn those signals into a health picture. The classic limitation is that single-signal, threshold-based systems either cry wolf or stay silent until damage is done, and building a bespoke model per machine does not carry across a plant, let alone a fleet.
This is the structural gap Physical AI is built to close. Where an LLM learns from text, Newton learns from the sensor data machines produce, fusing many signal types into one shared representation and finding both known and previously unknown failure patterns by observation rather than hard-coded rules. In one wind-energy deployment, a physical world model fused more than 40 sensor types across 63 turbines from roughly a year of unlabeled data and surfaced nine failure patterns the operator had never catalogued. At a process manufacturer, the same approach fused every available sensor stream to pinpoint the signals behind each predicted break and prevented about half of unplanned breaks, deployed in weeks rather than the months a per-asset model would take.
Running where the data lives matters for reliability too. On an edge device sitting on the asset, a model can separate normal from degrading states in real time, keeping more equipment running while cutting the false-alarm shutdowns that erode trust in monitoring. Reported in plain operational language rather than raw anomaly scores, those findings reach the people who act on them without a data-science translation layer in between.
Common Myths About Equipment Reliability
A few durable myths quietly undermine reliability programs.
The first is that newer equipment is automatically more reliable. New assets carry their own early-life failure risk from installation and commissioning, and reliability depends far more on maintenance practice, operating conditions, and component quality than on age alone. A well-maintained older machine often outperforms a poorly commissioned new one.
The second is that preventive and predictive maintenance are the same idea. Preventive maintenance acts on a schedule; predictive maintenance acts on the asset's measured condition. Both beat waiting for failure, but predictive avoids the waste of servicing healthy equipment and the risk of missing a machine that degrades early.
The third is that reliability belongs to the reliability engineers alone. In practice, operators who spot early symptoms, procurement choices about component quality, and design decisions upstream all shape how often assets fail. The programs that improve fastest treat reliability as a shared responsibility with clear ownership, not a specialist silo.
Frequently Asked Questions
What is the difference between reliability and availability?
Reliability is how often an asset fails; availability is how much of the scheduled time it is ready to run. Availability depends on both reliability and how quickly you repair failures, so a team can prop up availability with fast repairs while reliability declines. Watching both together prevents that blind spot.
How do you calculate MTBF?
MTBF equals total operating time divided by the number of failures over that period. If a machine runs 1,000 hours and fails twice, its MTBF is 500 hours. It applies to repairable assets; for parts you replace rather than fix, the equivalent metric is Mean Time To Failure.
Is OEE a reliability metric?
Not strictly. OEE combines availability, performance, and quality, so only its availability component is reliability-driven. It is best read as a productivity scorecard in which reliability is one of three inputs, not as a direct measure of how often an asset fails.
Can AI predict equipment failure without labeled failure data?
Increasingly, yes. Models that learn normal operation from unlabeled sensor data can flag deviations without a library of past failures, and physical world models such as Newton can adapt to a new asset from as little as one labeled example, which matters in reliability work where real failures are rare by design.
