
Nick Gillian and Dong Lin
Even when an AI model is given the right conclusion about a physical system, it can still be wrong about why. For measurements in the physical world, that gap between the outcome and the reasoning matters a lot. A plausible explanation built on misread measurements can send a clinician, an engineer, or a scientist in the wrong direction.
Archetype AI and Encord set out to see where that gap shows up when AI models explain real sensor data. Archetype builds Newton, a physical world model trained on sensor signals. Encord provides data infrastructure for Physical AI, bringing domain experts into model evaluation to test whether a model’s reasoning holds up against sensor measurements. We tested three models on ECG, HVAC, and atmospheric CO₂ data, giving each model the correct finding. All three repeated the finding, then backed it with reasoning that didn’t hold up. Read on to see where each explanation broke and what standard we’re building to address it. We’re excited to collaborate with Encord as part of the launch of Encord Data Labs, its new research division focused on how Physical AI data is captured, understood, and evaluated.
A heart monitor shows a slow, steady rhythm, with a pressure pulse after every ventricular electrical beat. A fan is running, but too little air is coming through. Atmospheric CO₂ falls and rises in a repeating seasonal cycle.
Each pattern has a likely explanation, but it’s harder to show which evidence in the measurements supports it.
Archetype and Encord are working together to ground AI explanations of physical systems in an accurate reading of the signals. When AI describes a physical system, can it connect its claims to the measurements, the operating context, and the relevant physical relationships? Can it tell which claims are backed by evidence, and when that evidence runs out?
To answer these questions, we tested three models on three sensor examples. We built the evaluation on Encord. Each sensor example was rendered as a chart and paired with a supplied finding, and domain experts reviewed every response against the underlying signals. The responses below are selected illustrations from that ongoing work. In each case, we gave the model an established finding and asked it to explain the evidence supporting it. That is an easier task than diagnosing the system from scratch. Even so, a model could repeat the correct finding while giving unreliable reasons.
Test 1: A patient on a heart monitor
A heart can keep pumping even when its normal electrical connection is interrupted. That is why interpreting a monitor takes more than spotting a pulse. The ECG and the arterial-pressure trace reveal different parts of the chain: electrical activation of the ventricles, followed by the pressure produced when they eject blood.
This example is a 20-second recording from a patient the dataset describes as an 80-year-old woman undergoing carotid surgery [1]. It pairs a lead-II ECG with an arterial line. The supplied finding is that the rhythm is slow, mechanically intact, and metronomically regular.
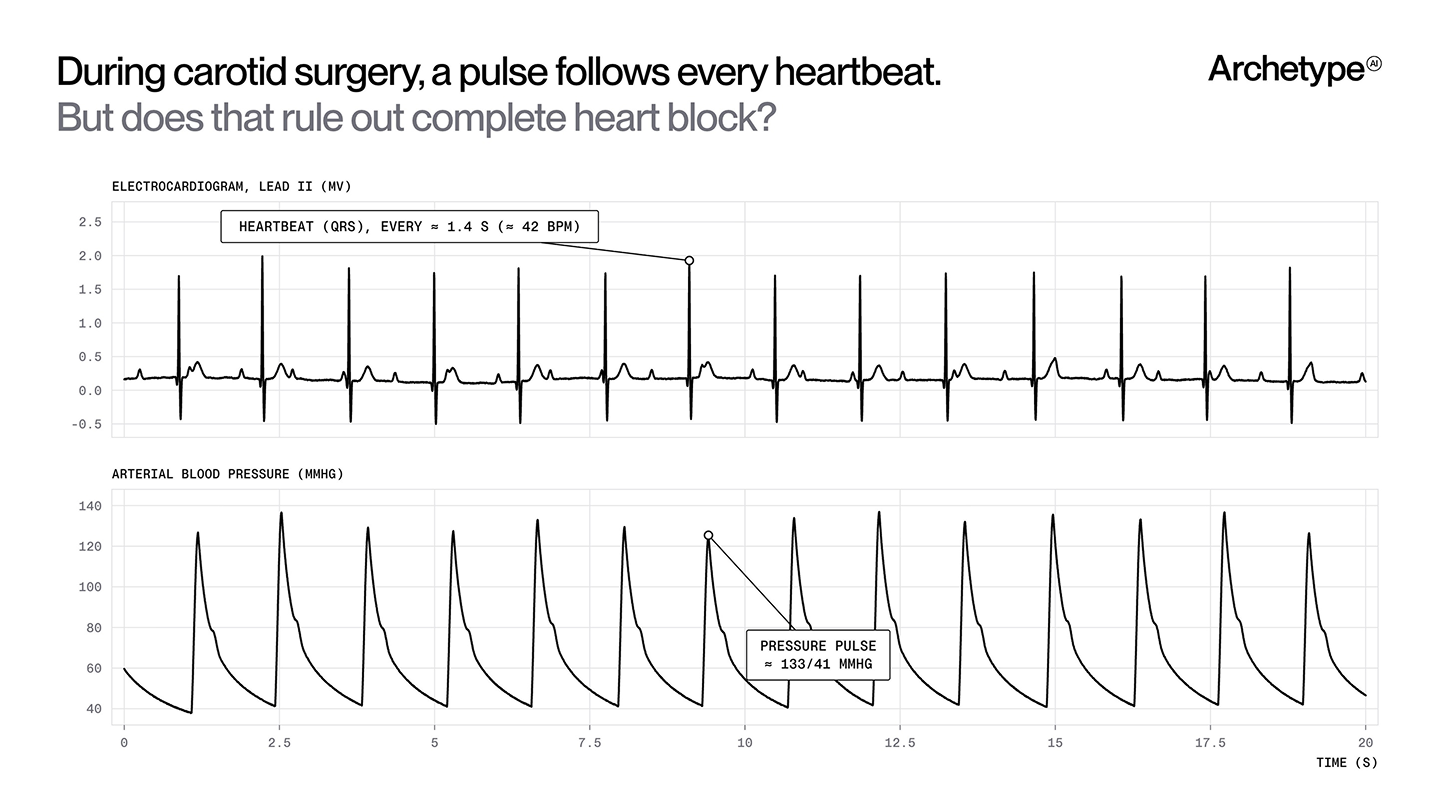
Figure 1. Twenty seconds of ECG (top) and arterial blood pressure (bottom).
Given the plot and operating context, Gemma 4 31B correctly recognized a slow, regular rhythm and a pressure pulse following each ventricular electrical beat. Then it wrote:
“Over the 20-second recording, there are 15 QRS complexes and 15 corresponding pressure pulses. This equates to a heart rate of 45 beats per minute. … This one-to-one coupling rules out electrical dissociation or pulse deficits, such as those seen in complete heart block or certain arrhythmias where electrical activity fails to trigger a ventricular ejection.”
The explanation confuses two different links. The plot shows that ventricular electrical activation (a QRS complex) produces a pressure pulse. Complete heart block concerns an earlier link: electrical signals from the atria fail to reach the ventricles. A backup pacemaker can still activate the ventricles, producing both QRS complexes and pressure pulses despite the block [2].
A pulse after every QRS therefore does not rule out complete heart block. The response incorrectly treats that condition as a failure of ventricular electrical activity to produce ejection. The evidence supports mechanically productive ventricular beats. It does not establish normal conduction from the atria to the ventricles.
The response also counts 15 beats where the plot shows 14, giving 45 rather than approximately 42 beats per minute. That smaller error leaves the slow-rhythm conclusion intact in this example, but it could lead to a wrong conclusion in another case.
A convincing explanation must distinguish “the heart is producing pressure pulses” from “the heart’s electrical conduction is intact.” Expert review through Encord helps separate a plausible explanation from a trustworthy one. A clinician can recognize that the model used evidence about blood being pumped to make an unsupported claim about electrical conduction. Expert evaluation can catch that gap even when the answer uses the right terminology and repeats the correct finding. That helps us ground the model’s reasoning in what the measurements actually establish.
Test 2: A building’s fan-coil unit
The U.S. Department of Energy estimates that heating, cooling, and ventilation account for about 40% of commercial building energy use in the United States [3]. A fan-coil unit moves air across a coil to heat or cool a space. When its sensor readings guide maintenance, telling an airflow problem from a measurement problem helps operators prioritize what gets fixed.
This example compares three simulated conditions of the same fan-coil unit [4]. The supplied finding is that Case C’s air path is severely obstructed. Fan speed, discharge airflow, and outside-air flow let us compare what the unit delivers when the fan runs at the same speed.
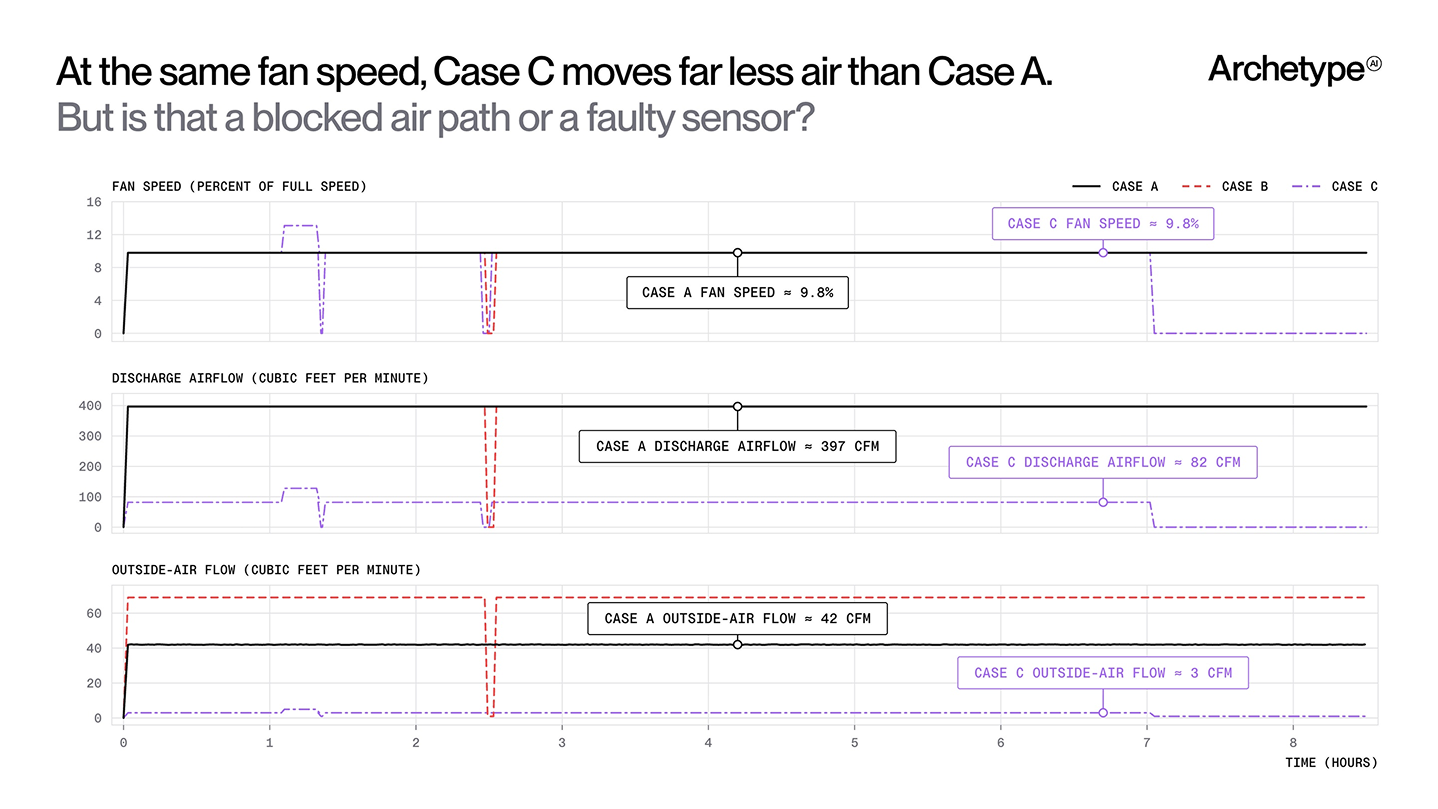
Figure 2. Fan speed, discharge airflow, and outside-air flow under three conditions of one fan-coil unit.
Claude Opus 5, given the plot and equipment context, read several measurements reasonably. At about 9.8% fan speed, Case C delivers roughly 82 cubic feet per minute (cfm) of discharge air, versus 397 in Case A. It also reported outside-air flow of roughly 3 cfm, versus 42 in Case A. Then it wrote:
“That pattern rules out a fan or drive fault, since the speed signal tracks normally and flow scales with speed; it also rules out a flow-sensor offset, because both flow channels fall by the same proportion.”
The numbers do not support that claim. Comparing Case C with Case A during their shared running-speed plateaus, discharge airflow falls by about 79%: (397 − 82) ÷ 397. Outside-air flow falls by about 93%: (42 − 3) ÷ 42. Put another way, about 21% of the discharge flow remains, but only 7% of the outside-air flow remains. These are not the same proportion.
The mistake is in the relationship between measurements. Opus uses the supposed proportional match to rule out a sensor offset, but that match is absent even from the numbers it had just cited.
The large discharge-flow deficit at a comparable fan speed supports the supplied obstruction finding. It does not make the model’s supporting argument valid. An explanation used to guide maintenance must distinguish evidence of poor airflow from evidence that rules out a measurement problem or identifies a particular failed component.
Test 3: Atmospheric CO₂
High on Hawaii’s Mauna Loa, Earth’s largest active volcano, an observatory tracks the buildup of carbon dioxide in the atmosphere. Measurements begun there more than six decades ago underpin the Keeling Curve, one of climate science’s defining records.
This example contains 454 weeks of CO₂ measurements [5]. The supplied finding concerns the seasonal shape: after removing the long-term rise, the values extend farther below their middle than above it. The plot shows the original measurements, with seasonal cycles superimposed on the rising baseline.
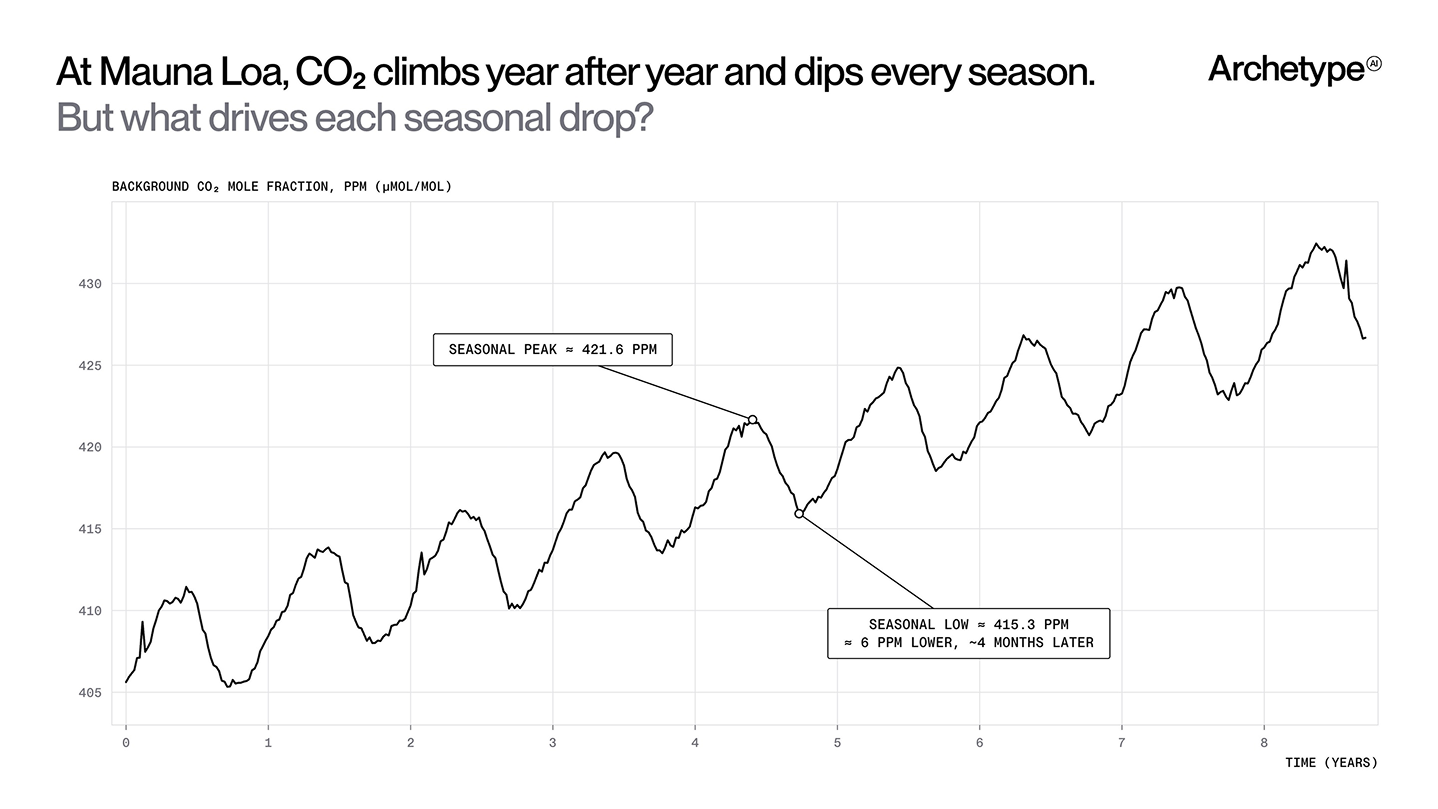
Figure 3. Weekly CO₂ at Mauna Loa across the nearly nine-year example window.
Qwen3-VL-235B-A22B-Instruct repeated the finding, then supplied a physical explanation:
“…autumn-winter decay and fossil fuel emissions combine to create deeper lows than spring-summer growth can offset with highs.”
The mechanism is backward. Decay and fossil-fuel combustion release CO₂ into the atmosphere, and photosynthesis removes it. NOAA’s explanation of the seasonal cycle attributes the seasonal decline to growing-season uptake by Northern Hemisphere plants [6].
This is more than a mislabeled season. An explanation in which carbon sources cause a decline and plant uptake causes a rise reverses the physical meaning of the signal. Anyone using it to understand why atmospheric CO₂ changes would be given the wrong causal account.
No forecast or warning depended on this answer, and the error is easy to check. Still, a model recognized the pattern and used the vocabulary of climate science, yet got the direction of the underlying processes wrong.
Together, these cases show why trustworthy interpretation requires reading the measurements correctly, checking which alternative explanations remain possible, and keeping each conclusion within the limits of the evidence.
When AI interprets the physical world, a compelling explanation is not enough. Trust depends on being able to ask, “What in these measurements supports that claim?” and receive an answer we can check. We want every consequential claim to have an identifiable basis, and every exclusion to state the evidence behind it.
An accurate understanding of the physical world
With Newton, Archetype AI’s physical world model, we want explanations that rely on what the measurements show. Newton is pre-trained across many physical systems, behaviors, and sensing modalities. Instead of memorizing how a motor, pump, or battery behaves, it learns to infer a system’s dynamics from observations of its behavior.
To go beyond plausible answers and get to trustworthy results, Newton is trained to analyze sensor measurements natively. It fuses sensor data with language deep in the model, so it can reason over the underlying measurements directly. This differs from common approaches that adapt sensor data to existing language or vision interfaces, for example by serializing measurements as text for an LLM or rendering them as charts for a VLM. These indirect representations can discard or obscure critical information, including fine-grained temporal dynamics, cross-sensor relationships, and subtle signal variations. That limits the fidelity of downstream analysis. Because Newton learns from sensor measurements alongside language, it preserves and interprets the information in the original signals rather than relying on potentially lossy textual or visual representations.
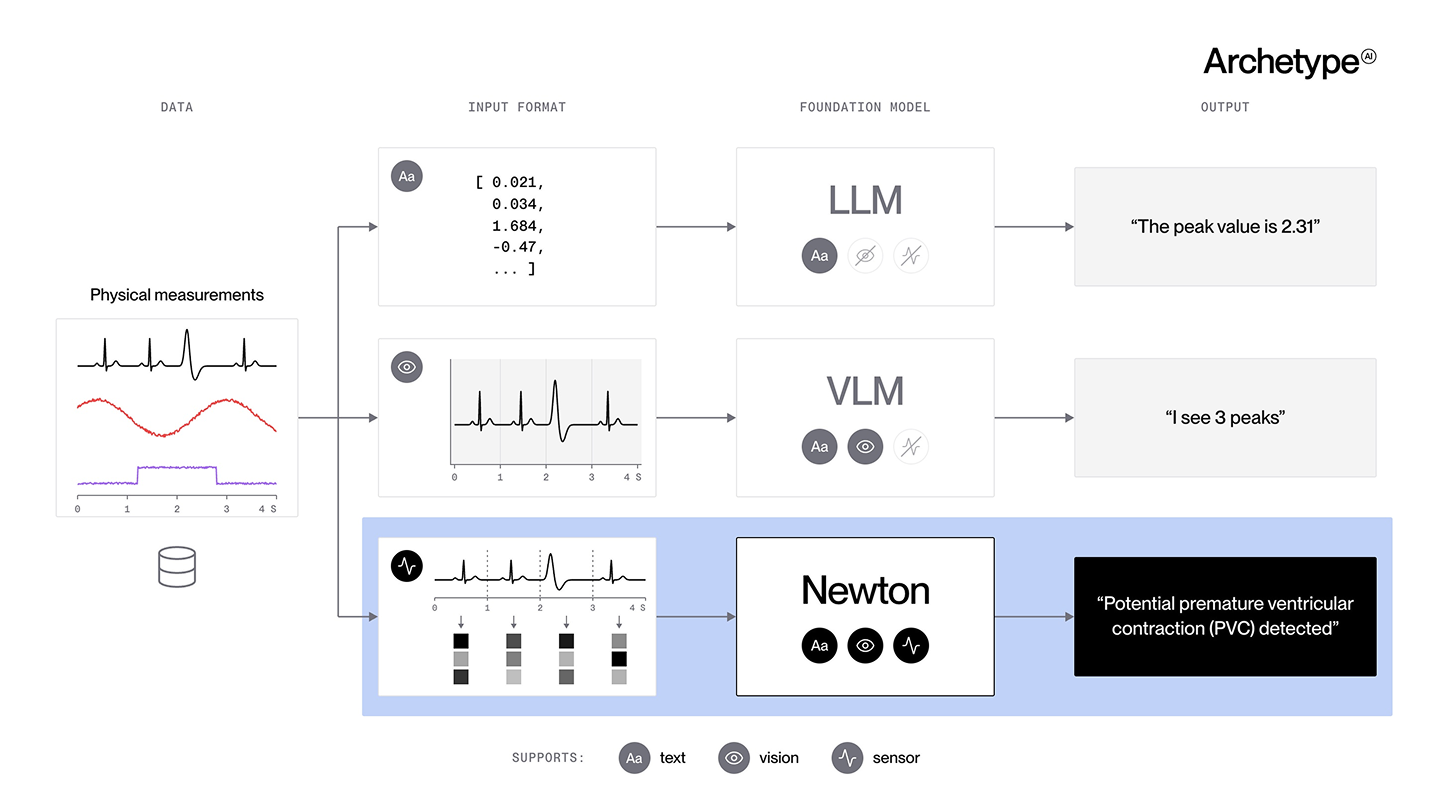
Figure 4. Newton natively reads sensor data, going beyond numbers-as-text or charts-as-pictures.
Given sensor data from a system it has never encountered, Newton builds a model of how that particular system behaves. This gives its explanations a basis in that system’s own measurements. Through our work with Encord, domain experts check whether Newton’s reasoning is correct: whether it reads the measurements accurately, whether its conclusions are justified, and whether it keeps uncertainty visible. Archetype AI uses these expert annotations to guide Newton’s improvement, helping ground its explanations in sensor evidence and domain knowledge.
Our aim is a Physical AI model that people can rely on in the places where a wrong explanation is costly: an operating room, a building’s mechanical systems, a long-term climate record. Every claim should trace back to a measurement someone can check. Archetype and Encord will share more results as the evaluation expands to new sensing modalities and domains.
Learn more about Newton:
- We Trained Newton on Radio Data. What Else Did It Learn?
- Can AI Learn Physics from Sensor Data?
- Teaching Language Models to Read the Physical World with Newton
- Adaptive World Models: Closing the Operational Intelligence Gap