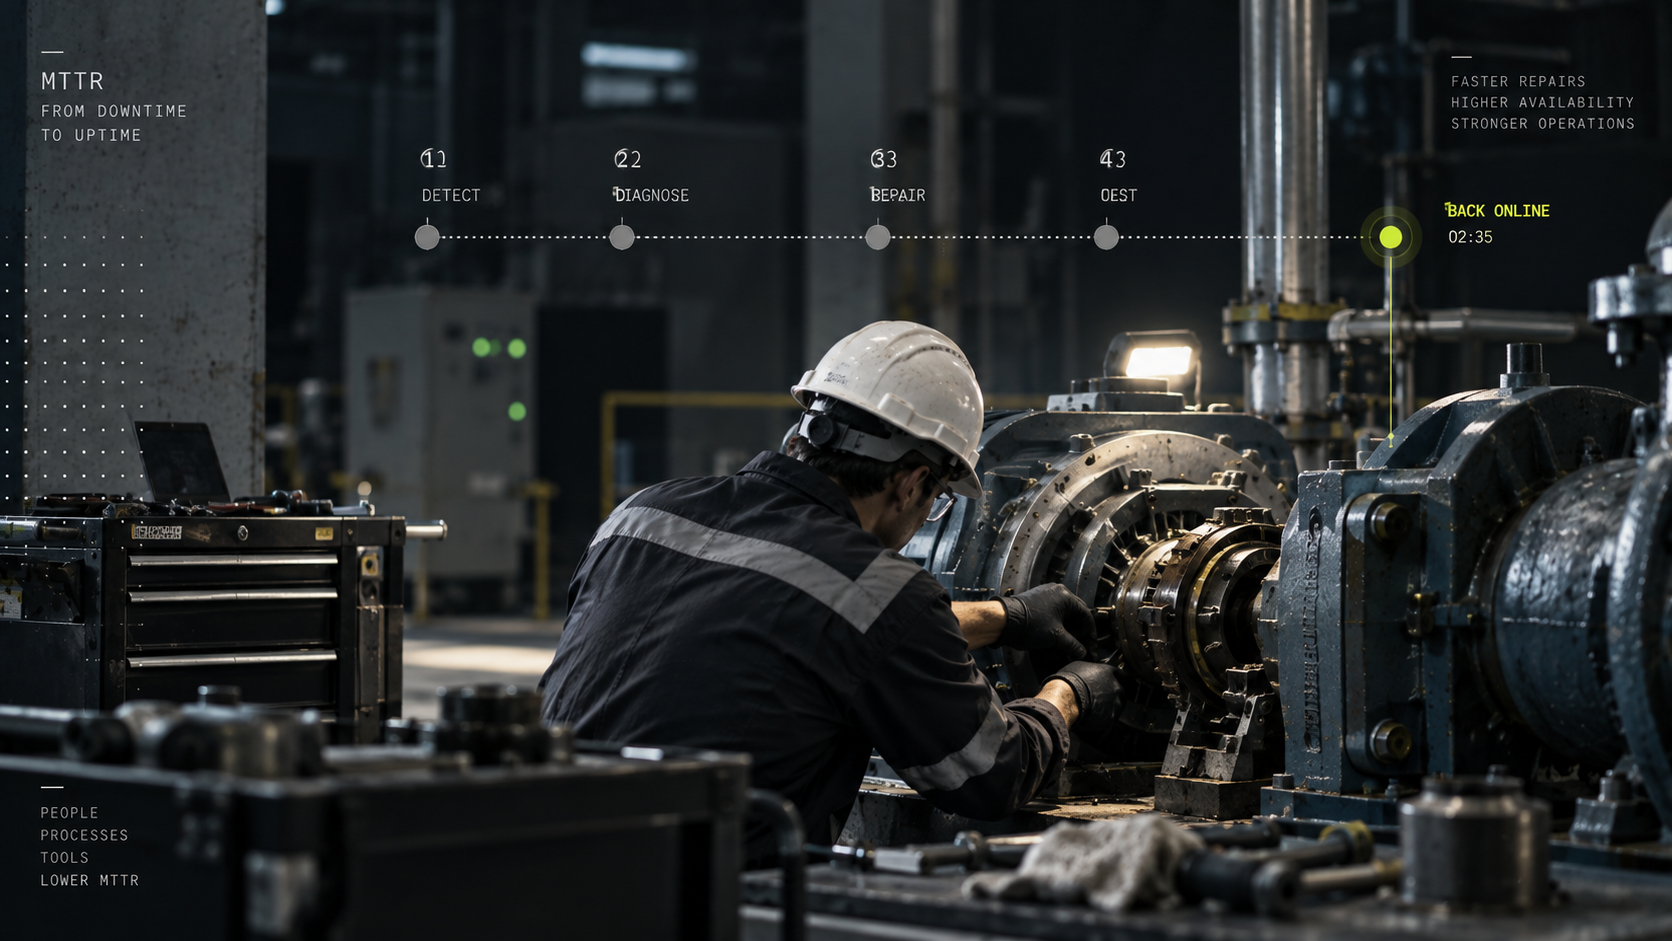
When a critical asset fails, two questions decide the cost: how often does it happen, and how long until it is running again? Mean time to repair, or MTTR, answers the second one. It is the metric that tells you how quickly your team restores a failed machine to service, and it sits at the center of every serious conversation about uptime, availability, and the real cost of unplanned downtime, which Deloitte estimates drains around $50 billion from industrial manufacturers each year.
What Is Mean Time to Repair (MTTR)?
Mean time to repair is the average time it takes to fully restore a failed asset to normal operation. IBM describes it as a measure of how quickly a system or piece of equipment is repaired after it fails, covering the time to detect the problem, diagnose the issue, and carry out the fix. A high MTTR means failures turn into long, expensive stoppages. A low MTTR means your team contains them before they cascade.
The abbreviation itself is a common source of confusion, because MTTR can stand for four different metrics that measure overlapping but distinct windows. Mean time to repair counts active repair work. Mean time to recovery counts the full downtime until service returns. Mean time to respond counts how long until a team starts working after an alert. Mean time to resolve counts everything through to a permanent fix that prevents the problem from recurring. For asset reliability, mean time to repair is the version that matters most, and this guide uses it in that sense throughout. The discipline that matters is picking one definition and applying it consistently, because comparing a repair-only figure against a full-recovery figure will make one team look twice as fast as another for no real reason.
How MTTR Relates to MTBF and Availability
MTTR rarely travels alone. It pairs with mean time between failures (MTBF), which measures how long an asset runs between breakdowns, and with mean time to failure (MTTF), used for components that are replaced rather than repaired. Together these metrics define availability, the share of time an asset is ready when you need it, through the standard reliability relationship: Availability = MTBF / (MTBF + MTTR).
That formula makes the stakes clear. You can raise availability by failing less often, which means increasing MTBF, or by recovering faster, which means lowering MTTR. Most reliability programs need to do both, because an asset that rarely fails but takes days to repair can still be less available than one that fails more often but recovers in minutes. For a fuller treatment of MTBF, MTTF, and how they roll up into availability, see our guide to equipment reliability metrics.
How Do You Calculate MTTR?
The formula is straightforward: divide the total repair time over a period by the number of repairs in that period.
MTTR = total repair time / number of repairs
If a production line logged three hours of repair work across two separate failures in a month, its MTTR for that month is 1.5 hours. The same math scales to a fleet: sum the repair hours across every asset in a plant, divide by the total number of repairs, and you have a plant-level MTTR you can trend against past periods and across sites. Watched over time, those figures reveal which assets consume the most repair hours, whether a new procedure actually shortened fixes, and where diagnosis is quietly eating the schedule.
The arithmetic is easy. The trap is in the inputs. The most common mistake is mixing up active repair time with total downtime. Strict mean time to repair counts only the hands-on repair work, from the moment a technician begins diagnosis and repair to the moment the asset is restored. It excludes waiting for parts, waiting for a technician to arrive, and waiting for approvals, which belong to a separate metric, mean down time. If you fold those delays into MTTR, you are no longer measuring repair efficiency, you are measuring your whole logistics chain, and the number becomes much harder to act on.
Two other pitfalls are worth naming. First, you have to define where the clock starts and stops and apply that definition to every incident, or the metric drifts. Second, MTTR is an average, so a handful of incidents on a rarely failing asset can produce a figure that swings wildly month to month and tells you very little. Accurate, consistently logged repair records are what turn MTTR from a vanity number into a decision tool.
Why Does MTTR Matter for Operations?
MTTR matters because it converts directly into availability, and availability converts directly into money. Every hour a line sits idle is lost output that cannot be recovered, plus emergency labor at overtime rates and expedited parts at premium prices. Deloitte's research puts the annual toll of unplanned downtime at roughly $50 billion for industrial manufacturers and notes that poor maintenance strategies alone can cut a plant's productive capacity by 5% to 20%.
Reducing MTTR is one of the most direct levers on that cost, because it shrinks the duration of every failure you have not managed to prevent. It also feeds the commitments you make to others. Service level agreements are often written around restoration times, so a rising MTTR can move an operation from comfortably inside its SLA to routinely breaching it, with financial penalties attached. In regulated or safety-critical environments, the same slow recovery that costs money can also extend the window in which an asset is unsafe or noncompliant.
Just as important, MTTR is diagnostic. A trend of climbing repair times points at real, fixable problems: aging equipment, thin spare-parts coverage, gaps in technician skills, or failure modes nobody has root-caused. Watched over time, it tells you where your maintenance program is losing hours and where an intervention would pay for itself.
How Can You Reduce MTTR?
The proven ways to reduce MTTR attack the parts of a repair that consume the most time. Standardized repair procedures and checklists keep fixes consistent and fast. Better troubleshooting tools and training help technicians reach the root cause sooner. Keeping commonly used spare parts on hand removes one of the biggest sources of delay. Root cause analysis, applied after incidents, stops the same failure from returning and inflating the average. IBM groups these under a simple principle: improving MTTR means systematically removing time from detection, diagnosis, and the fix itself.
The part that usually hides the most opportunity is not the wrench time. It is everything before it: noticing that something is wrong and working out what. On many assets, detection and diagnosis account for more of the clock than the repair, especially when the first sign of trouble is a threshold alarm that fires only after damage is already underway.
Physical AI platforms are the next step in compressing that detection and diagnosis window, which is why reliability teams are turning to foundation models built for sensor data. Newton, Archetype AI's Physical AI foundation model, was trained self-supervised on nearly 600 million real-world sensor measurements and fuses signals such as vibration, current, temperature, acoustics, and video into a single view of machine behavior. Unlike rule-based thresholds, which fire only after a reading crosses a preset limit, and unlike conventional machine learning, which needs a bespoke model and labeled failure history for every asset, a world model generalizes across equipment types without task-specific retraining. In practice, anomalies surface earlier and carry more context, so a technician can arrive already knowing which subsystem is drifting instead of starting diagnosis from a blank page. In one evaluation, Newton identified a developing fault in a submersible pump with roughly 95% accuracy. Because it can run on a single off-the-shelf GPU at the edge, that intelligence works in real time on the plant floor, where the data lives, rather than waiting on a round trip to the cloud.
This is the idea behind ready-to-deploy Newton Agents such as Anomaly Discovery, which learns what healthy operation looks like and flags deviations before a threshold trips, and Rare Event Detection, which can catch high-impact faults from only a handful of examples rather than a fully labeled failure history. Both aim at the same target: shortening the stretch between a fault beginning and a technician understanding it.
It is worth being precise about what this does and does not change. Faster, richer detection cuts the detect-and-diagnose share of MTTR, and catching faults earlier also means fewer catastrophic failures overall, which shows up as higher MTBF. Neither replaces the physical repair or the spare part on the shelf. The gain is in getting the right person to the right fault sooner, with a head start on the cause.
What Makes MTTR Hard to Improve?
The first obstacle is measurement itself. If teams disagree on when the repair clock starts, or log incidents inconsistently, the metric wanders and improvement is impossible to prove. Getting a shared, enforced definition in place is unglamorous but foundational.
The second is the diagnosis bottleneck. Complex assets throw ambiguous symptoms, and the time spent chasing a fault can dwarf the time spent fixing it. Coordination adds more delay: repairs that cross maintenance, operations, and outside contractors stall in the handoffs, and dependence on third-party parts or service can put a chunk of your MTTR outside your direct control.
There is also a scaling problem that has held back the smarter monitoring meant to help. Historically, catching failures early with machine learning meant building and maintaining a separate model for each asset and failure mode, a process that could take many months and scarce engineering talent per use case. That cost is why so much sensor data still goes unused, and it is precisely the barrier that a general, pretrained physical world model is designed to remove, by learning representations that transfer across assets instead of starting from scratch each time.
What Are the Best Practices for Managing MTTR?
Start by standardizing. Documented procedures, checklists, and technician training make repairs repeatable and shrink the variance that inflates averages. Pair that with disciplined root cause analysis and blameless postmortems after significant incidents, so each failure teaches the organization something and is less likely to recur.
Instrument the workflow. A computerized maintenance management system, or CMMS, captures work orders, repair history, and parts usage, which is what lets you calculate MTTR accurately and see where hours are going. Keep critical spares stocked and supplier relationships warm so parts delay does not dominate recovery. Above all, monitor MTTR against a baseline continuously rather than reviewing it once a quarter, and treat a rising trend as a prompt to investigate.
Finally, remember that the fastest repair is the one you never have to make. The upstream complement to a low MTTR is fewer failures in the first place, which is the job of condition-based maintenance and AI-driven predictive maintenance. Reducing repair time and reducing failure frequency are two sides of the same availability equation, and the strongest reliability programs work both at once.
Frequently Asked Questions
What is MTTR?
MTTR, or mean time to repair, is the average time it takes to restore a failed asset to normal operation, measured across the detect, diagnose, and fix stages of a repair. It is a core indicator of maintainability and a direct input to system availability.
How do you calculate MTTR?
Divide the total repair time over a period by the number of repairs in that period: MTTR = total repair time / number of repairs. For example, three hours of repair work across two failures gives an MTTR of 1.5 hours.
What is the difference between MTTR and MTBF?
MTTR measures how quickly you recover once an asset fails. MTBF, mean time between failures, measures how long an asset runs between breakdowns. Availability depends on both, through the relationship Availability = MTBF / (MTBF + MTTR).
What is a good MTTR?
There is no universal target, because a good MTTR depends on the asset, the industry, and the cost of its downtime. The more useful practice is to define MTTR consistently, establish your own baseline, and drive it down over time rather than chase a benchmark from a different operation.
Why do the four versions of MTTR cause confusion?
MTTR can mean repair, recovery, respond, or resolve, and each measures a different span of time. Teams that compare a repair-only number against a full-recovery number will draw false conclusions, so agree on one definition and apply it everywhere.
How can AI reduce MTTR?
Most of a repair's duration is often detection and diagnosis rather than the fix itself. Foundation models for sensor data, such as Newton, surface anomalies earlier and with more context and generalize across equipment without a model built per asset, which shortens the time to find and understand a fault so technicians can act sooner.
