
Archetype AI Team
What Is AI For Manufacturing Quality Control?
Which AI Techniques Power Quality Functions
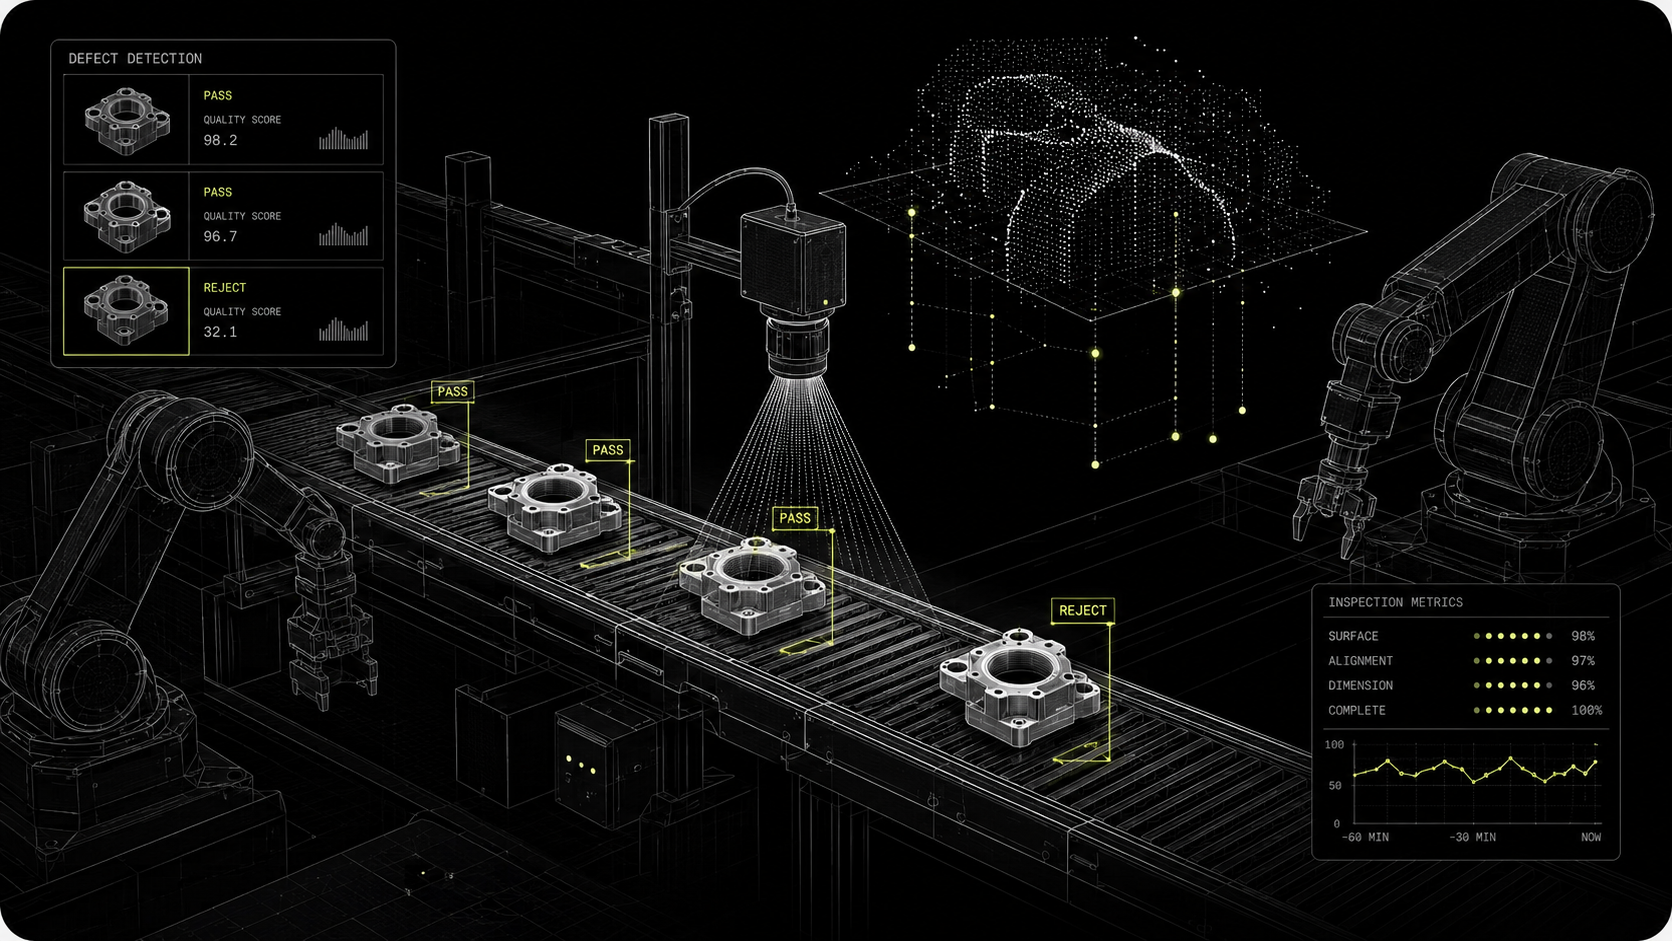
Computer vision powers most visual inspection tasks, using convolutional networks or modern attention-based architectures to spot scratches, dents, misalignments, and assembly errors.
Time series and sequence models handle sensor streams, spotting drift in temperature, vibration, or torque. Anomaly detection, both supervised and unsupervised, flags rare or novel failures when labeled examples are scarce.
Self-supervised and foundation models transfer broad physical understanding across assets, reducing the need to train from scratch. Language models and retrieval tools help parse operator notes, maintenance logs, and QA reports, turning text into actionable signals.
In practice, teams combine these techniques into hybrid pipelines that fuse images, signals, and metadata.
What Components Make Up A QC AI System
A QC AI system has several core layers: data capture, data processing, models, integration, and human interfaces.
- Capture includes cameras, lighting, and machine sensors. Processing covers edge preprocessing, feature extraction, and data lakes for historical context.
- Models perform detection, classification, and prediction, often with an anomaly module for unknown defects.
- Integration routes model outputs into MES, PLCs, dashboards, and ticketing systems.
- Interfaces present results to operators, enable annotations, and close feedback loops for retraining.
- Underpinning all layers you need data governance, model monitoring, and version control so quality decisions remain auditable and reliable.
How AI Differs From Traditional Inspection
Traditional inspection is rule driven and human limited, focused on fixed checks and sampled audits. AI scales inspection to every unit, adapts as products change, and quantifies uncertainty rather than giving binary pass or fail.
Instead of static thresholds, AI learns patterns across modalities and flags subtle deviations before they become major failures. It also enables continuous learning, so models improve as they see new defect types. That said, AI requires curated data, monitoring, and governance.
The stakes are large: NVIDIA puts the cost of poor quality and defects in manufacturing at roughly $7 trillion a year. The real shift is from reactive monitoring to predictive physical intelligence, where systems anticipate quality issues and trigger interventions earlier.
Which Quality Problems Can AI Solve?
How To Detect Surface And Visual Defects
AI handles surface defects by learning visual patterns that separate acceptable variation from faults. Use high-resolution imaging, controlled lighting, and segmentation or anomaly detection models to isolate scratches, pits, seams, and color defects. For rare defects, augment with synthetic examples or use unsupervised methods that model normal appearance and highlight outliers.
This matters because the defects that drive scrap and recalls are, by definition, rare — waiting for enough real examples can take a full year of production, which is why many inspection pilots never reach the line. Human-in-the-loop validation for borderline cases reduces false positives while building labeled sets. The result is consistent, high-throughput inspection that catches subtle defects humans miss.
How To Find Process Drift And Yield Loss
Process drift shows up as slow changes across sensors and production statistics. Multivariate time series modeling and change point detection find shifts in means, variance, or correlations that precede yield decline. Combine per-station signals with batch-level KPIs to spot systemic drift versus local noise. Early detection lets teams tune process parameters or swap tooling before yield drops.
Over time, foundation models for physical signals like Newton, Archetype AI's physical world model, let you detect drift across similar machines or sites without rebuilding a model for each line — because one model pretrained on billions of cross-modal sensor measurements generalizes across assets, OEMs, and aging equipment.
How To Accelerate Root Cause Analysis
AI accelerates root cause analysis by correlating defect occurrences with machine states, sensor anomalies, operator actions, and upstream process changes. Automated attribution ranks likely causes, turning hours of manual log sifting into minutes of prioritized hypotheses. Case retrieval finds past incidents with similar signatures and shows which fixes worked. Natural language tools summarize maintenance notes and link them to signal patterns, speeding decision making. This reduces mean time to identify and resolve the source of quality loss.
How To Improve Traceability And Documentation
AI automates the digital thread, linking images, sensor traces, model inferences, and operator actions to batch and lot IDs. That creates audit-ready evidence for regulators and customers, and simplifies recalls when they happen. Automated tagging and structured reports replace scattered spreadsheets, making compliance, warranty analysis, and continuous improvement far less manual. When teams standardize this infrastructure, they gain a searchable knowledge base that improves over time.
How To Build Vision Inspection Systems
How To Plan Data Capture And Lighting
Start with the failure modes you need to catch, then design capture to reveal those features. Choose resolution, focal length, and frame rate so defects occupy sufficient pixels. Lighting matters more than model architecture, aim for consistent, diffuse illumination to minimize shadows and highlights, or use raking light when surface texture is key. Control backgrounds and camera angles to reduce variance. Plan for sample diversity, capturing parts across shifts, tooling conditions, and operator handling to avoid a brittle model.
How To Label Data And Use Transfer Learning
Labeling must be precise, consistent, and focused on actionable categories. Use tools that let annotators mark regions, severity, and probable cause. When labeled examples are scarce, adopt transfer learning from models pretrained on industrial images or general vision backbones, then fine-tune on your dataset. Active learning speeds progress by surfacing uncertain examples for human review. Synthetic data and augmentation fill rare defect niches, but validate synthetic-to-real performance carefully to avoid distribution mismatch.
How To Deploy Models At The Edge
Edge deployment reduces latency and keeps IP on premises. Optimize models through pruning, quantization, or specialized runtimes to meet CPU and memory limits. Containerize inference, include health checks, and provide hooks for local buffering when connectivity drops. Build a lightweight monitoring agent to log predictions, confidence, and sample images for drift detection and retraining. Plan for secure OTA updates and clear rollback procedures so you can iterate without disrupting line ops.
How To Integrate Vision With PLCs And MES
Integration is event driven. Map inspection outputs to OPC UA or MQTT messages that PLCs and MES can consume, and design simple signal contracts like stop, rework, flag, or ignore. Ensure timestamps and batch identifiers are consistent across systems so traceability is reliable. Implement human override and cooldown windows to avoid oscillating stops. Finally, embed SLAs for inference latency and fail-safes so automation improves throughput without compromising safety or compliance.
How To Use AI For Predictive Maintenance
Which Sensors And Signals Matter Most
Vibration, motor current, temperature, and acoustic emissions are the core signals for many rotating and electromechanical systems. Pressure, flow, and torque are critical in fluid and process equipment. Encoders and cycle counters provide context on usage and wear. High-frequency sampling captures transient events, while lower-rate telemetry tracks long-term degradation. Quality signals from inspection systems themselves are often the strongest predictor of impending failure, so fuse QA outputs with machine health signals.
How To Detect Anomalies And Predict Failures
Anomaly detection starts by modeling normal behavior, then scoring deviations across time and sensors. Use a blend of unsupervised methods for unknown faults and supervised survival models when historical failure labels exist. Windowed features, spectral analysis, and envelope detection reveal imbalances and bearing wear. Ensemble methods reduce false alarms. Critical practice: produce lead-time estimates, not just binary flags, so maintenance teams can schedule interventions with minimal disruption.
How To Link Maintenance To Quality Outcomes
Tie maintenance logs, failure predictions, and quality metrics into a single analytics layer. Build models that predict both machine failure and downstream defect probability, so you can prioritize maintenance that yields the highest quality improvement per dollar spent. Use counterfactual experiments or A/B rollouts to validate that preventive actions actually reduce defects. Over time, this joint view lets organizations trade off uptime, cost, and quality with real data, turning maintenance from cost center to quality lever.
Note: foundation models for physical signals are the next step for these joint models, providing broad priors over machine behavior. Newton, Archetype AI's physical world model, fuses vibration, current, temperature, acoustics, and more in one shared representation, so quality and maintenance signals inform each other rather than living in separate tools. Because one model ports across assets and sites, each new line it covers is cheaper to bring online than the last.
What Tools And Platforms Should You Choose?
Which Commercial Platforms Fit QC Needs
Look for platforms that combine three capabilities: robust data ingestion from cameras and sensors, industrialized model lifecycle management, and seamless integration with MES and PLCs. Prioritize solutions that include built-in labeling workflows, edge runtimes, and audit trails for regulated environments. The platform should let you route images and signals into a single dataset, support mixed modalities, and surface model confidence and examples for human review. Avoid tools that treat vision or signals as separate islands. Your goal is an end-to-end stack that reduces engineering friction so teams spend time solving defects, not plumbing data.
When To Build Custom Models Versus Buy
Buy when the problem maps to common inspection tasks, you need fast time to value, or you lack large labeled datasets. Buy also when you need hardened edge runtimes and compliance features out of the box. Build when you have unique physics, proprietary defects, or domain signals that generic models miss.
Foundation models like Newton change the calculus: most use cases need no fine-tuning at all. You define them in natural language with a handful of in-context examples — instead of training a bespoke model per asset from scratch. That reduces build cost, but you still need strong domain labeling and validation. If latency, IP, or extreme accuracy are core requirements, plan to invest in custom modeling and the operational team to sustain it.
How To Evaluate AutoML, MLOps, And Edge Options
Test each layer independently. For AutoML, measure model quality on your holdout data, labeling effort required, and ability to inject domain constraints. For MLOps, evaluate model versioning, deployment repeatability, rollback, monitoring, and alerting for drift. For edge, validate runtime performance on your target hardware, cold-start behavior, and how the system logs samples for later analysis. Run small benchmark tests that include real production variance, not sanitized datasets. Insist on reproducible pipelines, clear SLAs for inference latency, and hooks for human-in-loop correction.
How To Compare Costs And Time To Value
Account for total cost of ownership, not just license fees. Include capture hardware, lighting, labeling labor, cloud training, edge hardware, integration engineering, and ongoing model ops. Estimate time to value by mapping required labeled examples to labeling throughput and expected model iterations. Use pilot ROI models that tie defect reduction to scrap, rework, and warranty savings, then factor in deployment time. Expect costs to shift from large upfront model development to ongoing data operations and monitoring. Foundation models and AutoML can compress initial timelines, but operational costs persist, so model the first 12 to 24 months, not just the pilot.
Which Metrics To Track For Success
What Inspection Accuracy And Error Metrics To Use
Track precision, recall, and F1 per defect class, not just a single aggregate accuracy. Monitor confusion matrices to see which defect types the model confuses. Log false positive and false negative rates separately, because their business impact differs. Track calibration and confidence distribution so you can threshold alerts reliably. For detection tasks, include intersection over union and localization error. Measure inference latency and throughput too, since a model that is accurate but slow breaks production constraints.
What Business KPIs To Measure Impact
Translate model gains into operational KPIs: scrap rate, rework rate, first-pass yield, throughput, cycle time, warranty claims, and customer returns. Track cost per defect detected and cost avoided per intervention. Include downstream metrics like reduced downtime or improved supplier quality. Measure lead time to corrective action, not just detection. Use paired comparisons or A/B rollouts to isolate the model's contribution, and report ROI in dollars per week or per batch to keep leadership attention.
How To Design Dashboards For Operators And Managers
Design two views: operator and manager. Operator dashboards must be concise, showing real-time alerts, one-click evidence (image plus trace), suggested action, and feedback buttons to confirm or override. Keep color and wording unambiguous. Manager dashboards should show trends, defect distributions, model performance over time, and economic impact. Provide drill-down from trends to sample cases and corrective actions. Embed SLA indicators and a simple status for model health and data freshness so nontechnical stakeholders can act.
How To Scale AI Across Plants
How To Run Pilots And Prove ROI
Start with a scoped pilot that targets a high-frequency, high-cost defect and runs long enough to capture process variance. Define clear success criteria up front, including baseline rates, target improvement, and sample size for statistical confidence. Use A/B lanes or shadow modes to compare outcomes without disrupting production. Capture cost savings from reduced scrap and rework, and include secondary benefits like faster root cause analysis. Publish a rollout playbook after pilot success, with required data specs, acceptance tests, and incremental milestones for plant-by-plant deployment.
How To Standardize Data And Model Governance
Standardize schemas for part IDs, timestamps, sensor sampling rates, and label taxonomies across sites. Create a model registry that enforces versioning, ownership, and rollback procedures. Define labeling standards and inter-annotator agreement thresholds. Require automated lineage so every inference is traceable to a model, dataset, and configuration. Automate drift detection and gate retraining behind tests that validate cross-site performance. These governance layers turn local pilots into enterprise assets, letting teams reuse datasets and models rather than recreating work at each plant.
How To Manage Change And Train Teams
Treat rollout as people change first, tech change second. Identify plant champions and give them decision authority for local tuning. Build short, practical training modules that teach operators how to read model outputs, annotate edge cases, and trigger reinspection workflows. Supply playbooks for false positives, escalation paths, and rollback. Incentivize participation by tying quality goals to operator metrics or recognition. Maintain a central center of excellence to capture learnings, provide support, and update standards as models evolve.
What Are Common Implementation Mistakes?
How To Avoid Poor Labeling And Data Bias
Bad labels are the single biggest failure mode. Invest in clear taxonomies, annotator training, and regular quality audits. Sample data across shifts, tooling, and suppliers to prevent blind spots. Use disagreement analysis to find ambiguous categories and refine guidelines. Be cautious with synthetic data, validate on holdout real samples, and avoid conflating visual quirks with true defects. Track class imbalance and apply targeted collection to underrepresented failure modes.
How To Prevent Overfitting And Model Drift
Validate on time-split and site-split holdouts, not just randomized folds. Regularly test models on fresh production data before rollout. Use conservative early-stopping, augmentation that reflects real variance, and ensembling where appropriate to improve robustness. Monitor drift in input distributions and prediction patterns, and set automated alerts when performance degrades. Schedule retraining based on data volume or performance triggers, not arbitrary timelines.
How To Ensure Continuous Feedback Loops
Build lightweight feedback paths from operators into training pipelines. Capture misclassifications, near misses, and manual overrides automatically with contextual data and timestamps. Prioritize samples for labeling via active learning so annotator effort focuses on high-value cases. Automate retraining pipelines that validate candidate models against production holdouts and push updates with clear rollbacks. Reward teams for feeding high-quality labelled cases, because continuous learning depends on consistent human input.
What Regulatory And Safety Issues Apply?
How To Meet Industry Quality Standards
Start by mapping your QC AI outputs to the standards auditors expect, for example ISO 9001 and IATF 16949 in automotive, and functional safety frameworks such as IEC 61508 where automation can affect safety. Define acceptance criteria that mirror those standards, not just model metrics, so pass/fail decisions link to documented tolerances and sampling plans. Capture evidence per batch, images and sensor traces with timestamps and part IDs, so every automated decision has an auditable trail. Finally, bake change control into your model lifecycle, with testing gates, approvals, and controlled rollouts so models update only after validation against the same standard-based tests inspectors use.
How To Handle Data Privacy And Security
Classify data up front, separate sensitive PII and supplier IP from operational telemetry, and apply least-privilege access. Encrypt data in transit and at rest, but also consider edge-first architectures that keep raw images or traces on premises to reduce exposure. Harden model endpoints, require mutual TLS for integration with MES and PLCs, and log access for forensic audits. Protect model artifacts too, with repository access controls and signed deployments, because models encode business value and risk. Finally, include supply chain security checks for third-party components and OTA updates so you don't introduce vulnerabilities when rolling out models across sites.
How To Ensure Explainability For Audits
Design explainability to match what an auditor will ask for, not an ML engineer. Keep model cards and versioned lineage that state training data ranges, performance on holdouts, and known failure modes. For vision tasks, store representative exemplars, saliency maps, and counterfactuals that show why the model flagged a part. For signal models, log feature importances, windowed traces, and lead-time estimates that tie predictions to actionable thresholds. Combine uncertainty estimates with human-in-the-loop overrides so auditors see both the decision rationale and the human validation pathway, and retain all evidence long enough to satisfy regulatory retention rules.
Which Use Cases And Case Studies Work Best?
What Automotive And Electronics Examples Show
Automotive lines typically benefit from surface and weld inspection, paint defect detection, and gap-and-flush measurement, where vision models catch defects at higher throughput than manual checks.
Electronics examples include PCB solder joint inspection, connector seating, and optical inspection of semiconductor wafers, where tiny anomalies correlate strongly with downstream failures. These environments produce dense, repeatable signals, which is why Physical AI often finds high signal-to-noise ratios and fast ROI. The pattern is the same, whether panels or boards: pick a single, high-cost defect and instrument it well.
What Small Manufacturer Pilots Look Like
Small manufacturers run lean pilots: one camera, controlled lighting, a single defect class, and a shadow-mode deployment that logs decisions without stopping the line. They collect a few hundred to a few thousand labeled examples, use transfer learning or a foundation model to jump-start performance, and iterate with operator feedback. Costs stay modest because pilots avoid full MES integration, focusing on proving defect detection and economic impact first. Success is clear when scrap or rework drops and operators trust the alerts enough to act on them.
What Measurable Results Companies Achieved
Typical, repeatable gains include 20 to 60 percent reductions in scrap or rework for targeted defect classes, substantial drop in escape-to-customer rates, and faster root cause resolution measured in hours rather than days. Those ranges track with the World Economic Forum and McKinsey's Global Lighthouse Network findings, where computer-vision quality deployments have cut defect rates by roughly half within months and top sites report 20 to 60 percent improvements across throughput and quality KPIs.
Throughput often improves because automated inspection runs at 100 percent sample rate, turning spot checks into full-line coverage. Payback windows for pilots that target high-cost defects are frequently 3 to 12 months, assuming actionable integration with rework flows. Those numbers vary, but they show the shift from reactive checks to predictive physical intelligence delivers both quality lift and cost savings.
What Is The Quick Start Playbook?
What A Minimal Viable Quality Project Looks Like
A minimal viable quality project targets one defect type on one production line with clear KPIs, for example reducing rework on a connector seating operation. Scope data capture to the few sensors and cameras needed to expose that defect, run models in shadow mode for 4 to 8 weeks, and only enable automated actions after human validation thresholds are met. Keep acceptance criteria binary and measurable, like percent reduction in false negatives or lower scrap per shift. The goal is to show real economic impact before expanding scope.
Which Roles And Skills You Need First
Assemble a small cross-functional team: a plant champion who owns outcomes, a QA engineer with domain knowledge, a data engineer to collect and pipe signals, an ML engineer to train and deploy models, and an operator representative for ground truth and feedback. Add a DevOps or edge engineer to manage runtimes and OTA updates. You'll rely heavily on domain expertise early, because the physical world generates the signals models learn from, and those who understand the process will guide labeling and acceptance rules.
What Data And Infrastructure To Gather
Capture high-quality, consistent inputs: controlled lighting for cameras, synchronized timestamps, part and batch IDs, and relevant machine telemetry like temperature, vibration, and cycle counts. Store raw evidence for each inference, a compressed copy of images and traces, and a metadata layer for context. Provide a labeling workflow that preserves severity, region, and operator notes. For infrastructure, plan for edge compute for low latency, a secure data lake for historical training, a model registry, and monitoring pipelines that collect prediction confidence and sample drift.
Which Timeline And Budget To Expect
Expect a pilot timeline of 3 to 6 months from kick-off to validated ROI signal, shorter if you leverage foundation models and transfer learning. Budget ranges vary by scope: small pilots often land in the $50k to $200k band including cameras, lighting, labeling, cloud training, and integration work. Full line rollouts scale that up, commonly $200k to multiple millions depending on sites and hardware. Most of the spend is not model training, it's capture hardware, labeling, integration with MES/PLCs, and ongoing model ops. Plan for ongoing operating costs after deployment, because continuous data operations sustain value.
Note on foundations: a physical world model like Newton, from Archetype AI, can compress the data and training a pilot needs. Instead of training a bespoke model per defect or per line, Newton works out of the box and is adapted from a handful of in-context examples, then reused across assets. That way, a pilot spends its time proving impact rather than collecting and labeling a dataset for each new line. In one manufacturing deployment with NTT DATA, that approach cut AI deployment from months to weeks, with all production data kept on-site. Because one model ports across lines, that speed and reuse compound as you scale.
FAQs
What Is The Best AI For Manufacturing Quality Control?
There's no single best model, it depends on input types and constraints. For vision tasks, modern attention-based backbones fine-tuned on industrial images work well. For sensor streams, temporal models or foundation models for physical signals capture dynamics better than static classifiers. Hybrid pipelines that fuse images, signals, and metadata usually outperform single-modality systems. Choose models that meet your latency, explainability, and audit requirements rather than chasing benchmark winners.
How Do I Get An AI For Manufacturing Quality Control PDF?
If you want this article as a PDF, export the page to PDF from your browser or request a whitepaper from your platform owner. Alternatively, compile your project notes, screenshots, and model cards into a single document using any document editor and export to PDF. If you want a tailored PDF with a pilot checklist and cost template, tell me the target defect and I'll draft one you can export.
Can You Show AI For Manufacturing Quality Control Examples?
Yes, common examples include paint and weld inspection in automotive, solder joint inspection on PCBs, and bearing wear detection from vibration traces. If you give me a use case and available signals, I can sketch an architecture, recommended sensors, and a minimal data capture plan with sample labeling guidelines.
How Does AI Compare With Traditional QC Methods?
Traditional QC relies on rules, manual sampling, and human judgement. AI scales inspection to every unit, adapts as products change, and quantifies uncertainty so you can act before defects escalate. The trade-off is that AI needs curated data, governance, and monitoring, whereas rule-based systems can be simpler to certify initially. The real advantage is moving from reactive checks to predictive physical intelligence, catching subtle drifts humans miss.
Which AI Tools Help Warehouse And Inventory Management?
AI helps warehouses through vision-based counting and damage detection, OCR and NLP for automated document parsing, demand forecasting with time series models, and anomaly detection for inventory shrinkage. Robotics and pick-assist systems use perception and grasp planning to reduce handling errors. The same principles apply: fuse multiple signals, keep evidence trails, and design human-in-loop checkpoints to handle edge cases.
How Much Does A QC AI Project Typically Cost?
Costs depend on scope and scale. A focused pilot often costs $50k to $200k, covering cameras, lighting, labeling, compute, and integration. A plant-level rollout can be $200k to $1M, and enterprise-scale programs across many sites can reach several million. Ongoing costs include labeling, model ops, edge maintenance, and governance. Factor in expected savings from scrap reduction and warranty avoidance to calculate payback, typically 3 to 12 months for successful pilots that target high-impact defects.
What 2026 Deployments Reveal About Making QC AI Stick
Even a strong model can stall on the factory floor. A 2025 MIT study found that about 95% of enterprise AI pilots delivered no measurable P&L impact, with the gap tracing to implementation and organizational adoption rather than the technology itself. In a 2026 Archetype AI session with NTT DATA, the same pattern showed up on quality lines, where inspection cameras were sometimes unplugged by operators who had never been told what the system was for. The teams that succeed pair the technical build with AI literacy and change management, from the C-suite down to the people doing assembly.
It also shapes how a quality-AI project gets funded. Instead of pitching AI, the deployments that win budget attach to a specific P&L line (scrap, rework, warranty, or escape-to-customer cost) with a measurable target. As NTT DATA's Managing Director of Physical AI, Raleigh Murch, framed it: stop selling AI, start with a business objective, and find a P&L line item to gravitate toward. Real-time quality monitoring clears that bar precisely because its outcomes are countable in defects avoided and dollars saved.
This is also why it is worth revisiting inspection projects that failed the first time. Many plants tried computer-vision inspection and hit a wall of brittle pipelines, constant drift, and models that broke when the line, lighting, or product changed. A physical world model like Newton changes what is solvable: it fuses camera, sensor, and text streams into one representation and adapts to a new station or operating condition from a handful of n-shot examples instead of a fresh training cycle — which puts those abandoned projects back on the table.
One caution carries into any QC pilot: having data is not the same as having AI-ready data. A historian full of sensor and image logs is not yet a pipeline a model can consume, so budget for the data engineering that turns archives into live, labeled, well-synchronized streams before expecting results.