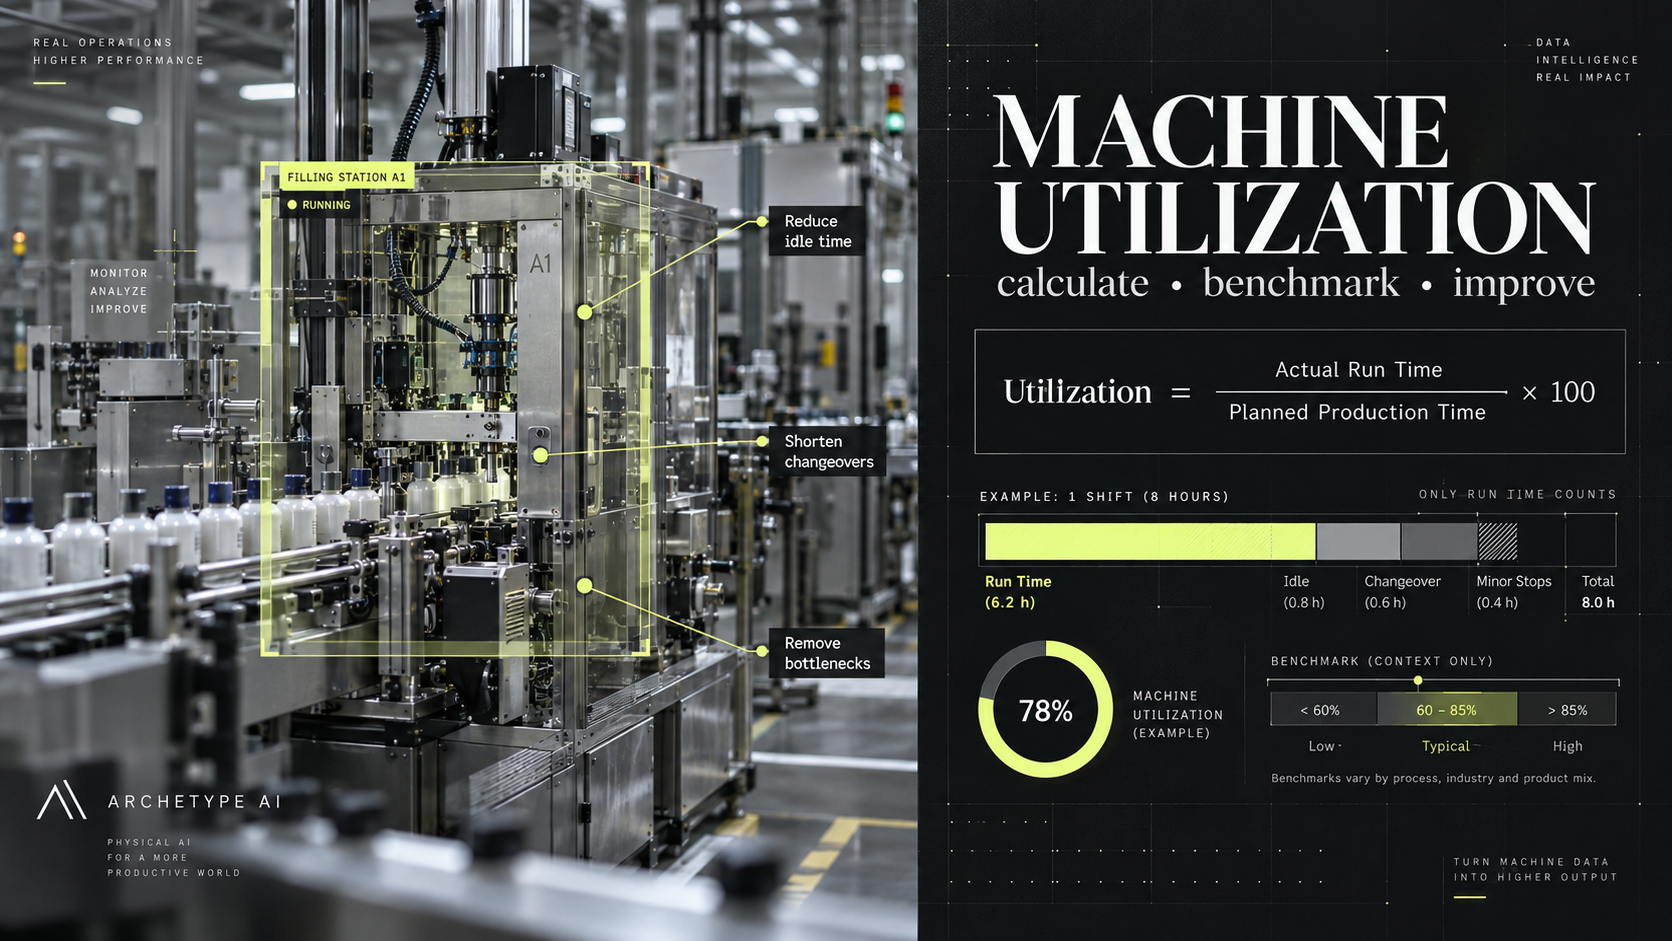
Machine utilization looks like the simplest number on the plant floor: of the time a machine could have run, how much of it actually ran. The trouble starts when that single figure reaches three people who each mean something different by it. Finance hears spare capacity, operations hears availability, and maintenance hears uptime. A metric this easy to calculate is deceptively easy to misread, and the gap between the utilization a plant reports and the utilization it actually achieves is usually where lost output hides. This guide states the machine utilization formula precisely, separates it from the metrics it gets confused with, and shows where the recoverable capacity tends to sit.
What Is Machine Utilization?
Machine utilization is the percentage of available time that a machine spends actually running. It answers one operational question: when this equipment was scheduled to produce, how much of that time did it spend producing.
That sounds interchangeable with efficiency and with Overall Equipment Effectiveness, but the three measure different things, and conflating them is the most common reporting error in this area. Utilization is a time measure: running time over available time. Efficiency compares actual output to expected output for the time the machine did run, so it speaks to speed, not presence. OEE goes further still, folding availability, performance, and quality into a single score, so a machine can post high utilization and mediocre OEE if it runs constantly but slowly or produces scrap. Seiichi Nakajima, who defined OEE within Total Productive Maintenance, built it precisely to stop plants from celebrating a machine that is merely busy rather than productive.
The practical misconception follows from the same looseness. A high utilization number is not automatically good news. A machine can run at 90 percent utilization and still lose a fifth of its potential output to slow cycles and defects that utilization alone never sees. Deloitte estimates that weak maintenance strategy alone can cut a plant's productive capacity by 5 to 20 percent, and most of that loss never surfaces in a utilization figure because the machine was technically running the whole time. Utilization tells you whether the asset was on. It does not tell you whether the time was well spent.
How To Calculate Machine Utilization?
The machine utilization formula is straightforward: divide the hours a machine actually ran by the hours it was available to run, then multiply by 100.
Machine Utilization = (Run Time / Available Time) x 100
The formula is trivial. The definitions inside it are where teams disagree. Run time is usually the cleaner term: the hours the machine was actively producing, pulled from controller logs or a monitoring system. Available time is the argument. If you define it as scheduled production time, a single eight-hour shift, you measure how well you used the shift you planned. If you define it as all calendar time, every hour of every day, you measure how much of the asset's total capacity you tapped. Both are valid. They answer different questions, and a utilization number is meaningless until you say which denominator produced it.
A worked example makes the split concrete. Suppose a machine is scheduled for two eight-hour shifts, so 16 hours, and runs for 13 of them after changeovers and a short breakdown. Against scheduled time, utilization is 13 divided by 16, or 81 percent. Against the full 24-hour calendar, the same 13 hours is 54 percent. Nothing about the machine changed. Only the denominator did.
The errors cluster around that denominator. Teams quietly drop planned downtime, breaks, or unstaffed shifts out of available time to flatter the result, then compare that number against a benchmark built on a different definition. The fix is not a better formula. It is one written definition of available time, applied the same way every time and on every asset being compared.
Which Factors Influence Machine Utilization?
Machine utilization rises and falls on three levers: downtime, scheduling, and the people running the line.
Downtime is the obvious one, and it splits in two. Planned downtime, meaning changeovers, cleaning, and scheduled maintenance, is deliberate and shows up in the schedule. Unplanned downtime is the expensive kind, and it dominates the cost conversation: Deloitte puts the annual bill for unplanned downtime across industrial manufacturers at roughly 50 billion dollars. Every hour a machine sits down unexpectedly is an hour of available time that produced nothing, which is a direct hit to utilization and a compounding hit once you add emergency labor and expedited parts.
Scheduling is the quieter lever and often the larger one. A machine cannot be utilized against time it was never staffed to run. Long changeovers, poor sequencing, and material that arrives late all convert available time into idle time without any equipment ever failing. Plants chasing a utilization target frequently find that their biggest recoverable block is not breakdown time at all but the white space between jobs.
The workforce sits underneath both. Operators decide how fast changeovers go, how quickly a stoppage is noticed, and whether a small anomaly gets flagged or ignored until it becomes a failure. None of this is captured by the utilization formula itself, which is exactly why utilization is a starting question rather than an answer. It tells you how much available time was lost. Finding out why means looking at the downtime, the schedule, and the floor together.
What Is Total Effective Equipment Performance (TEEP)?
Total Effective Equipment Performance, or TEEP, is the metric that stops a plant from hiding behind its own schedule. It measures effectiveness against all the time that exists, not just the time you chose to staff.
TEEP extends OEE with one more factor:
TEEP = OEE x Utilization
Here utilization is defined against the full calendar: planned production time divided by all 168 hours in a week. OEE already tells you how productive the machine was during the hours you scheduled it. Multiplying by calendar utilization asks a harder question: how much of the asset you paid for did you actually use across all available time. A line can post a respectable 75 percent OEE and a TEEP in the low twenties simply because it runs one shift on a five-day week. Nothing is broken. The capital is just idle most of the time.
The arithmetic is quick. Take that same 75 percent OEE machine running one 40-hour shift week against a 168-hour calendar. Calendar utilization is 40 divided by 168, or about 24 percent. TEEP is 75 percent multiplied by 24 percent, which lands near 18 percent. The OEE number says the shift ran well. The TEEP number says more than four fifths of the machine's total capacity went untouched.
That is why TEEP matters for anyone making an investment or expansion decision. OEE is the operator's and plant manager's metric: improve the running of the shifts you have. TEEP is the executive's metric, because it exposes whether the answer to more output is a new machine or a second shift on the one already installed. Reporting only OEE, or only shift-based utilization, keeps that question invisible. TEEP is deliberately unflattering, and that is its value: it counts the nights and weekends the asset spent doing nothing.
How To Benchmark Machine Utilization Rates?
There is no single good utilization rate, and any benchmark quoted without a shift pattern attached is close to meaningless.
Start with the arithmetic ceiling. A plant running one eight-hour shift, five days a week, is staffing 40 of the 168 hours in a week, so its calendar utilization cannot exceed about 24 percent no matter how flawlessly it runs. A two-shift operation tops out near 48 percent. Only a true 24/7 line can approach the high numbers people casually throw around. This is why a 30 percent utilization figure can be excellent in one plant and alarming in another, and why cross-plant comparisons collapse unless everyone uses the same denominator.
Two widely quoted benchmarks get misapplied here. The 85 percent world-class figure comes from Nakajima's work on OEE, not utilization, and it assumes availability near 90 percent, performance near 95 percent, and quality near 99 percent multiplied together. It is a quality-and-speed benchmark for scheduled time, not a statement about how many hours a machine should run. Typical discrete plants sit closer to 40 to 60 percent OEE. Separately, the roughly 76 percent capacity utilization the Federal Reserve reports for US manufacturing is an economic measure of output against sustainable maximum output, not a floor-level machine metric at all. Borrowing either as a utilization target is a category error.
Industry shapes the ceiling too. Continuous-process plants in chemicals, steel, or paper are engineered to run around the clock, so high calendar utilization is both expected and necessary to justify the asset. Discrete and job-shop operations run to demand, carry frequent changeovers, and will show structurally lower utilization without anything being wrong. Comparing a make-to-order machine shop against a continuous caster on a single utilization number tells you about their business models, not their performance.
The defensible approach is to benchmark against your own trend and your own shift model first, and only then against peers who calculate the metric identically. A rising utilization trend on a fixed definition tells you more than any industry average pulled from a page that never states its denominator.
How To Improve Machine Utilization?
Improving utilization comes down to converting idle available time back into running time, and the biggest gains usually come from seeing losses sooner.
Real-time monitoring is the foundation. You cannot recover downtime you only discover at the end of a shift, and much lost utilization is death by a thousand micro-stops that no one logs. Continuous machine data makes the pattern visible: which assets stall, when, and around which jobs. From there, predictive maintenance attacks the unplanned downtime that does the most damage, catching degradation before it becomes a breakdown so the stop happens on your schedule rather than the machine's. These are vendor-neutral moves, and we cover the mechanics in our guides on predictive maintenance and on improving equipment uptime.
Physical AI platforms are the next step here, which is why it is worth understanding where they differ from what came before. Rule-based monitoring only catches the failure modes someone thought to encode a threshold for. Conventional machine learning does better but is built one model per asset, a process that can take many months of engineering per machine and does not transfer to the next one. A world model like Archetype's Newton is a distinct third approach: trained self-supervised on close to 600 million real-world sensor measurements, it fuses vibration, current, temperature, acoustics, and video into one representation and generalizes across equipment types without a bespoke model for each. It runs at the edge on a single off-the-shelf GPU, so detection happens on the floor in real time rather than after a round trip to the cloud. In one industrial deployment it identified anomalies on a submersible pump with 95 percent accuracy, the kind of early catch that turns an unplanned stop into a planned one and hands that time back to utilization.
The common thread across all of this is that the decisions get made on data rather than intuition. A utilization number on its own prompts a target and a guess about where the losses are. The same number backed by continuous signal shows exactly which asset, which shift, and which changeover is bleeding time, so improvement effort goes where the recoverable hours actually are instead of where the last complaint came from.
Reading Machine Utilization Correctly
Machine utilization earns its place as a first-look metric because it is fast to calculate and hard to argue with: the machine was either running or it was not. Its weakness is the same as its strength. A single percentage invites everyone to read their own meaning into it, and the number is only as trustworthy as the definition of available time behind it. Treat utilization as the opening question, not the verdict. Pair it with OEE to see whether the running time was productive, and with TEEP to see how much of the asset you are paying for actually earns its keep across the full calendar. The plants that get durable gains are not the ones chasing a higher headline number. They are the ones that fixed their definitions, watched the trend, and went after the idle time the formula pointed to.
Frequently Asked Questions
What Is the Formula for Machine Utilization?
Machine utilization equals run time divided by available time, multiplied by 100. Run time is the hours the machine was actively producing. Available time is either scheduled production time or total calendar time, and the number means nothing until you state which one you used.
What Is a Good Machine Utilization Rate?
It depends entirely on your shift pattern. A single-shift plant cannot exceed about 24 percent calendar utilization, so a strong result there looks nothing like a strong result on a 24/7 line. Benchmark against your own trend on a fixed definition before comparing to anyone else. The 85 percent world-class figure people cite is an OEE benchmark, not a utilization target.
What Is the Difference Between OEE and Machine Utilization?
Utilization measures only whether the machine was running during its available time. OEE multiplies availability by performance and quality, so it also captures whether the machine ran at speed and produced good parts. A machine can show high utilization and low OEE if it runs constantly but slowly or with high scrap.
What Is the Difference Between Utilization and TEEP?
Utilization is a single factor: running or planned time against a chosen denominator. TEEP is OEE multiplied by calendar utilization, so it measures true effectiveness against all 168 hours in a week. TEEP is the metric that reveals whether unused nights and weekends are your real capacity constraint.
