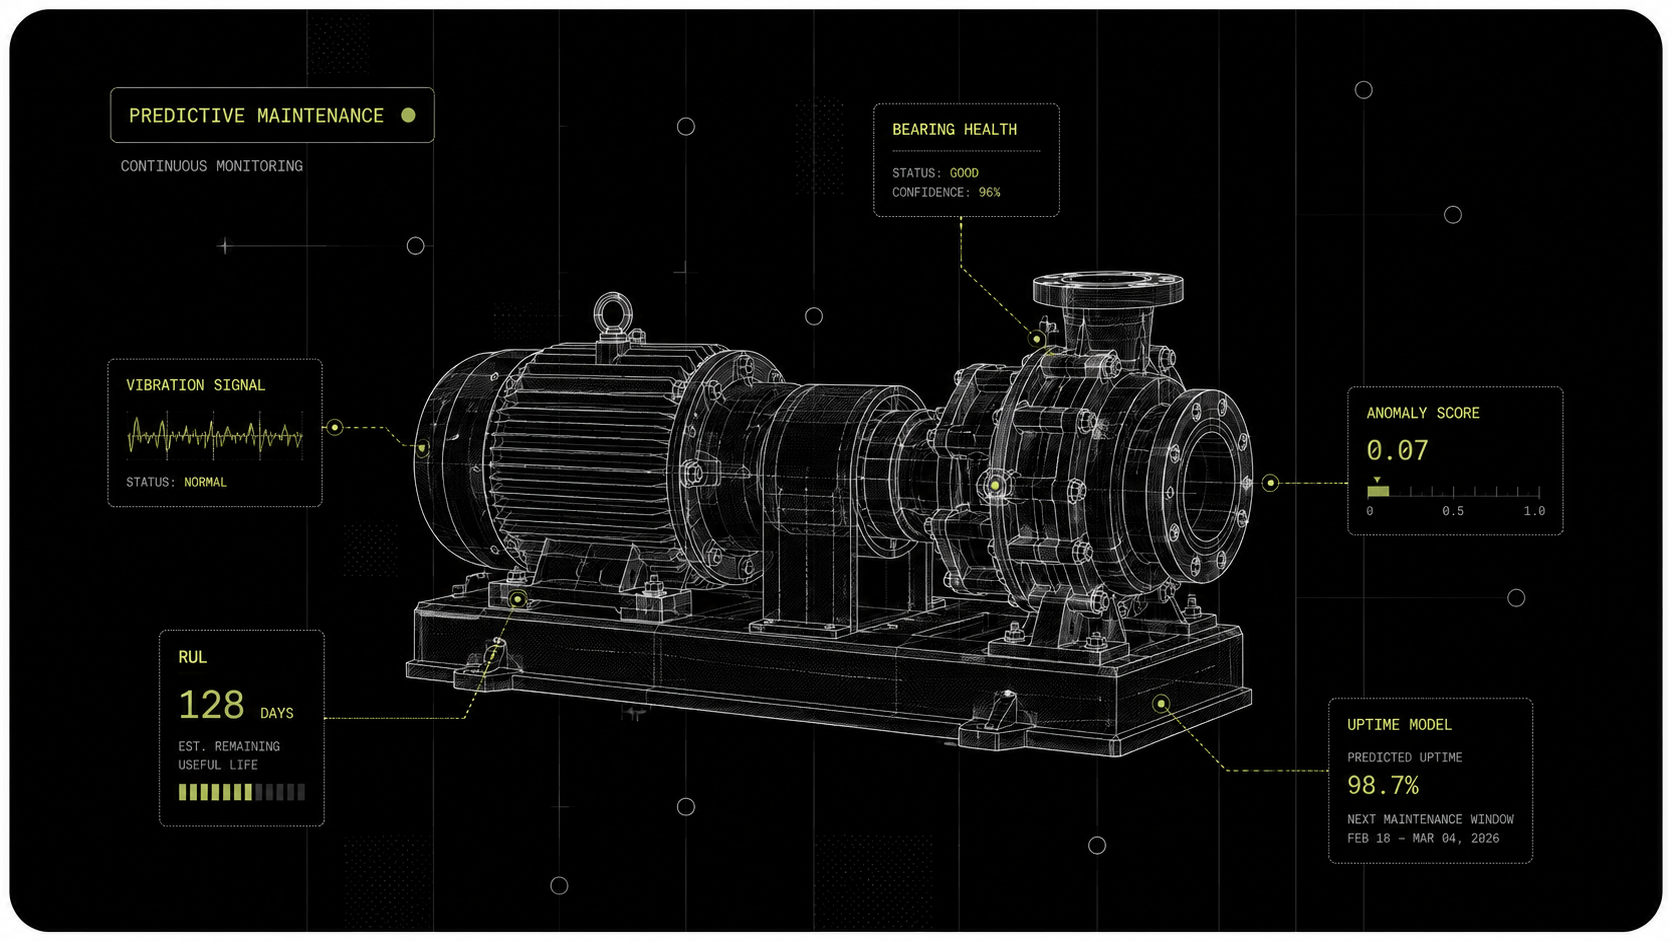
What Is AI Predictive Maintenance?
Predictive maintenance uses AI to forecast equipment failures before they happen, so teams can schedule repairs on their terms instead of reacting to breakdowns. It turns raw sensor streams and operational records into actionable signals that say, this part is degrading, replace it within X days to avoid downtime. The stakes are high: Siemens reports that the cost of unplanned downtime to large manufacturers has risen sharply since 2020, which is why predictive maintenance has moved from a nice-to-have to an operational priority.
The promise is simple, the implementation is not. You need continuous signals, historical failures, and models that account for context like load, environment, and operator behavior. The physical world generates trillions of sensor signals that AI has barely touched, so there's huge upside for teams that invest in the right infrastructure.
Predictive Versus Preventive Maintenance
Preventive maintenance follows fixed intervals, like servicing every 6 months, regardless of actual health. It reduces random failures but wastes parts and labor when machines are healthy. Predictive maintenance, by contrast, schedules work based on estimated wear and failure risk, cutting unnecessary interventions and lowering unplanned downtime.
Reactive maintenance waits for alarms and failures. That remains common because data is missing or models are immature. The shift from reactive monitoring to predictive physical intelligence is happening now, driven by better sensors, edge compute, and models that understand physical behavior.
Common AI Techniques Used
Classic supervised models map features to labels like time to failure or failure probability. When labeled failures are rare, unsupervised and self-supervised methods are preferred. Time series models include LSTM and temporal CNNs, but contrastive learning and transformer-style architectures are gaining ground for long-range dependencies.
Anomaly detection draws on statistical control charts, clustering, and density estimation. For Remaining Useful Life estimation you see survival analysis, regression forests, and sequence-to-sequence deep models. Foundation models for physical signals, such as Newton, let teams reuse learned representations across equipment types, reducing the need to train from scratch.
Physical AI platforms are the next step here, which is why Archetype packages Newton into ready-to-deploy Newton Agents. Because single-source methods can't fully capture industrial anomalies while multimodal fusion detects them more robustly, the Anomaly Discovery agent learns what healthy operation looks like and surfaces previously unknown failure modes before thresholds trip, while the Rare Event Detection agent catches high-impact faults from only a handful of examples.
How AI Detects Failures Early
Detecting failures early is a mix of pattern recognition and context. You want methods that flag subtle deviations and quantify confidence, so maintenance planners can act with clarity instead of guessing.
Anomaly Detection Methods
Start simple, with baseline statistics and rolling windows to catch sudden shifts in mean or variance. Move to unsupervised ML when normal behavior is complex, using autoencoders, isolation forests, or clustering that learns what healthy looks like.
Self-supervised contrastive techniques create representations of normal operation without failure labels. These representations make small deviations stand out. Sensor fusion helps too, combining vibration, temperature, and electrical signals to reduce false positives — interpreting those streams together, rather than one at a time, is exactly how a physical world model like Newton powers the Anomaly Discovery agent. For operators, explainability matters, so pair detection with feature attributions or example-based explanations.
Estimating Remaining Useful Life
RUL models predict how long a component will run before failing. You can treat it as regression, survival analysis, or probabilistic forecasting. Sequence models map historical windows to future life estimates, and probabilistic models provide uncertainty bounds that maintenance teams can plan around.
Calibration is critical. Overconfident RUL predictions cause missed failures, underconfident ones cause wasted work. Techniques like Bayesian neural nets, quantile regression, and ensemble methods produce uncertainty estimates. When failure labels are scarce, transfer learning from related machines or foundation models speeds convergence and improves accuracy.
Which Data Streams Matter
Not all data is equal. The best predictors mix high-frequency physics data with low-frequency operational and human-generated information. Assemble both, then let models decide which signals matter for each failure mode.
Sensors And Operational Data
Vibration, temperature, current, pressure, and acoustics are primary physics signals. Sampling rate and sensor placement determine what you can detect. Operational context, like RPM, load, and duty cycle, changes baseline behavior and must be modeled alongside sensors. The Operational State Monitoring agent does this continuously, mapping the distinct operating regimes a machine cycles through — and flagging which ones quietly drive wear and cost.
Edge preprocessing reduces bandwidth by computing features near the machine. That preserves signal fidelity and supports faster local alarms. The physical world is noisy, so redundancy across sensors and modalities improves robustness.
Maintenance Logs And Quality Data
Work orders, failure codes, inspection reports, and quality measurements are rich context. They explain root causes, repair actions, and recurring issues. Those human records are messy, but language models and domain-specific NLP make them usable at scale.
Linking text records to time series lets models learn which symptoms correspond to which fixes. The result is not just earlier detection, but smarter recommendations, shorter MTTR, and better spare parts planning.
Handling Sparse And Noisy Data
Many fleets never see full failure cycles, so labels are sparse. Fill gaps with weak labels, proxies like alarm escalations, or simulation-derived events. When sensors drop out or are noisy, imputation, smoothing, and sensor fusion keep models stable.
Physics-informed models and transfer learning reduce reliance on large labeled sets. Foundation models that understand physical signals let you extract useful embeddings even from limited data. That few-shot capability is what the Rare Event Detection agent relies on: shown a few instances of a costly failure, it watches for that signature across every asset, an approach recent industrial anomaly models show is resilient to noise and drift. Teams that standardize data quality and metadata early avoid a lot of downstream pain.
How To Build A Data Pipeline
A reliable pipeline moves raw signals to production models with traceability. It needs to handle scale, heterogeneity, and change. The teams building Physical AI infrastructure today will have an unfair advantage in the next decade.
Data Ingestion And Storage
Ingest telemetry as a mix of high-frequency streams and event records. Store raw time series in a time series database or an object store with compact, indexed formats. Keep metadata, device topology, and calibration histories linked to each stream.
Contract your data schema up front, version it, and enforce it at ingestion. Edge aggregation and compression limit costs and latency, while replayable raw archives enable retraining and audits.
Labeling And Feature Engineering
Labeling strategies include supervised failure tags, weak labels, and automatic proxies. Label windows relative to failure events, and store label provenance so you can trace what changed in a model update.
Feature engineering blends domain-crafted metrics, like spectral features or bearing kurtosis, with learned embeddings from foundation models. Combining handcrafted and learned features often outperforms either alone. Automate feature lineage so you know which features influence predictions in production.
MLOps And Model Retraining
Treat models like software with CI, testing, and deployment pipelines. Monitor model performance, input drift, and prediction distributions in real time. Use shadow testing and canary rollouts to validate updates before full production rollout.
Set retraining triggers based on drift, new failure labels, or scheduled cadences. Maintain model registries, reproducible experiments, and rollback capabilities. As physical world models like Newton make domain adaptation faster, focus your MLOps on governance and continuous evaluation rather than endless bespoke training.
With Newton Agents, teams adapt a ready-to-deploy agent to their own operations from a handful of examples — McKinsey notes gen-AI maintenance tools can be deployed in weeks rather than months — so Physical AI becomes something you deploy, not something you build from scratch.
Teams that build robust ingestion, labeling, and retraining cycles gain compounding returns. Early movers in construction, telecom, and smart cities are already reaping benefits. If your organization invests now in Physical AI infrastructure, you won't just reduce downtime, you'll create a strategic moat. Archetype AI, the team behind Newton, its physical world model, has been working in this space and shows how reusable physical representations accelerate these outcomes.
Which Models Work Best
Time Series And Survival Models
Time series models capture temporal patterns in sensor streams, useful for detecting drift, cyclic wear, and sudden anomalies. Use sliding windows, spectral features, or learned sequence embeddings to expose precursors that precede failures. Survival models, like Cox variants or accelerated failure time models, translate those signals into probabilistic time-to-failure estimates, which maintenance planners prefer because they map directly to scheduling decisions. Combine both when you need event timing plus a sense of evolving health, for example feeding time series embeddings into a survival head to get calibrated risk over time. Prioritize models that output uncertainty, because planners act differently on a 90 percent probability than on a 10 percent one.
Deep Learning Versus Classical Models
Classical methods, like random forests or gradient-boosted trees, win when labeled failure examples are limited and features are hand-crafted from domain knowledge. They're fast to iterate, explainable, and often adequate for many failure modes. Deep learning shines when you have high-frequency signals, complex cross-sensor interactions, or massive unlabeled data that benefit from self-supervised pretraining. Deep models learn hierarchical features directly from raw streams, reducing brittle feature engineering. In practice, blend approaches: use deep embeddings as features for a classical model, or keep a simple model in the safety loop for interpretability. Choose the approach that matches data volume, latency needs, and how much trust operators require.
Digital Twins And Physics Models
Physics-informed models and digital twins embed real-world mechanics into predictions. They're essential for failure modes driven by wear physics, thermodynamics, or structural stress, where purely data-driven models struggle to extrapolate beyond observed regimes. Digital twins provide simulated failure cases, accelerate labeling, and give counterfactual what-if analysis for maintenance strategies. They're heavier to build, so target them where the cost of unexpected failure is high or where you can validate models against rich telemetry.
Foundation models for physical signals, like Newton, can bootstrap both data-driven and physics-aware approaches, letting teams reuse physical representations instead of starting every model from scratch. In practice, this is where Newton can complement a digital twin: the twin supplies simulated failure cases and what-if scenarios, while Newton Agents such as Operational State Monitoring and Rare Event Detection interpret live sensor data against those physics-grounded expectations, flagging when real-world behavior drifts from the modeled regime — without building a bespoke model per asset.
How To Deploy On The Floor
Edge Versus Cloud Deployment
Edge inference keeps latency low and saves bandwidth, critical for fast alarms or when connectivity is intermittent. Deploy lightweight models or feature extractors at the edge, and reserve cloud for heavier retraining, cross-fleet aggregation, and long-horizon forecasting.
Hybrid architectures are common, with raw data preprocessed at the edge, summaries sent to cloud, and cloud models sending updated weights back to edge devices. Factor in compute availability, security, and maintenance overhead when choosing placement. Start simple, prove value, then migrate the right workloads to the edge as needs mature.
Integrating With CMMS Systems
Predictions are useless unless they convert to actionable work orders. Map model outputs to your CMMS taxonomy, including failure codes, priority levels, and labor skill requirements. Automate ticket creation for high-confidence events, but include metadata: predicted failure window, supporting evidence, and recommended parts. Sync asset hierarchies and spare parts lists so alerts align with existing workflows. Use APIs or message-based syncs to avoid manual transcription and to preserve audit trails. Track downstream outcomes in the CMMS, because closed-loop data sharpens models and proves impact.
On the workforce side, the Task Verification agent confirms each step of a repair or procedure was performed in order and to spec from video and operational context, improving quality and compliance once work orders reach the floor.
Designing Operator Alerts
Design alerts to be actionable and trustworthy. Start with three principles: reduce noise, include context, and define next steps. Tune thresholds to balance recall and workload, and expose uncertainty so operators can triage. Established practice here is alarm rationalization under standards like ANSI/ISA-18.2 to strip out nuisance alarms.
Physical AI is the next step, since the Anomaly Discovery agent flags genuinely emerging issues that fixed rules never encoded. Provide brief evidence, like recent sensor trends or a top feature attribution, so technicians can validate quickly. Build escalation paths for persistent or high-severity risks, and allow operators to annotate outcomes to feed model improvements. Run alerts in shadow mode before automated ticketing to calibrate behavior against real operator judgement.
How To Prove ROI Quickly
Uptime And Performance Metrics
Measure availability, MTBF, MTTR, and OEE before and after deployment. Capture baseline downtime costs per hour by line, site, and asset class. Track near-miss avoidance and reduced emergency work orders as leading indicators. Use a control group or A/B test where possible, so improvements are attributable to the AI intervention rather than seasonal or operational changes.
Calculating Payback Period
Estimate incremental savings from reduced unplanned downtime, fewer expedited parts, and lower overtime. Subtract implementation and recurring costs, including sensors, edge compute, integration, and ops overhead. Run sensitivity analysis across conservative and optimistic scenarios to show best and worst-case payback. Often a focused pilot on critical assets yields payback within months, because avoided emergency shutdowns have outsized value.
Avoiding False Positive Costs
False positives create wasted maintenance and loss of trust. Quantify the cost per false positive, including parts, labor, and production impact. Use that number to set operating points and to justify shadow testing and manual validation phases. Implement tiered responses: low-confidence alerts trigger inspections, high-confidence ones trigger work orders. Track the cost of false positives over time and fold it into model tuning and operator training so your system becomes both safer and cheaper to run.
How To Scale Across Fleet
Pilot Design And Criteria
Run pilots that prove technical performance and operational fit. Pick assets with frequent failures or high downtime cost, and include a diversity of conditions so models generalize. Define success upfront, with clear metrics, timeboxes, and minimum data volume requirements. Keep pilots short and measurable: a three-to-six month window often suffices to show signal and capture enough events for statistical confidence.
Operational Change Management
Scaling is mostly human work. Involve maintenance, operations, reliability, and procurement from day one. Update SOPs to reflect predictive workflows, retrain planners and technicians, and create incentives for adopting evidence-based maintenance. Designate champions at each site to reduce friction. Communicate wins early, but be transparent about limitations. The teams that embed AI into decisions, not just dashboards, capture the most value.
Monitoring And Continuous Improvement
Treat deployments as living systems. Monitor model performance, input drift, and business KPIs continuously. Automate data capture of inspection outcomes and repair results to close the feedback loop. Set retraining cadences driven by drift or new failure modes, and keep a rollback path for model updates. Capture playbooks, successful patterns, and failure cases so knowledge scales faster than just code. Organizations that standardize telemetry, model governance, and reuse learned representations will build a lasting advantage in Physical AI.
What Governance To Put In Place
Model Explainability And Audits
Explainability is not optional when predictions drive work orders. Provide traceable evidence for every high-impact decision, including: the input windows used, top contributing features, and a confidence range. Use model cards and decision logs so auditors and technicians can see what changed between versions. Audit cadence should include:
- pre-deployment checks, validating performance on holdout sites and safety cohorts;
- periodic post-deployment audits comparing predictions to inspection outcomes;
- third-party reviews for high-consequence assets.
Tools that produce feature attributions, example-based explanations, and counterfactuals reduce friction between ML teams and frontline technicians. Design explainability outputs for the user, not for the model developer: short, actionable statements that feed into a work order.
Safety And Compliance Controls
Predictive outputs affect people and processes, so embed safeguards. Start with risk tiers: low-confidence alerts require human verification, high-confidence ones may trigger automated work orders only after a safety review. Maintain an approvals registry for any automated action that impacts safety or regulatory compliance.
Compliance controls to enforce:
- versioned model approvals with traceable signoff;
- test suites that include edge cases and safety scenarios;
- retention of raw telemetry and labels for forensic review;
- procedures for admitting or rejecting model-driven repairs.
Regulatory regimes vary by industry, but the pattern is the same, document everything and prove you can reproduce a decision from raw inputs to action. That discipline also helps when you want to scale across sites and jurisdictions.
Cybersecurity For OT Systems
Operational technology environments are not IT. Protect inference pipelines and edge devices with OT-native practices: network segmentation, least privilege, and strict change control for device firmware and model updates. Secure update channels with code signing and rollback capability to limit blast radius if a bad model or compromise is detected.
Add detection for adversarial or anomalous inputs, because sensor spoofing or misconfiguration mimics failure modes. Runtime integrity checks, attested boot on gateway devices, and isolated model evaluation zones reduce risk. Finally, coordinate with site SOC and plant engineers so cybersecurity measures respect uptime needs and maintenance windows.
Common Implementation Mistakes
Data Quality Shortcomings
Bad inputs produce bad predictions fast. Common failures are unsynchronized timestamps, missing metadata (sensor IDs, calibration), silent sensor drift, and inconsistent failure labels. Fix these early:
- enforce ingestion contracts and schema validation at the edge;
- store raw data plus transformed features to enable reprocessing;
- capture label provenance, who labeled what and why.
Don't ignore small operational realities, like swapped sensor wiring or seasonal operating modes. Those quirks create blind spots. The physical world generates trillions of signals, but only disciplined data practices let models learn useful patterns.
Overfitting And Model Drift
Teams often report great pilot metrics that evaporate in production. Typical causes are leakage from improperly split timelines, too-small failure sets, and models tuned to idiosyncratic assets. Mitigate with time-aware validation, cross-site holdouts, and conservative baselines that include simple statistical detectors.
Drift is continuous. Instrument drift detectors for inputs and for prediction distributions, trigger retraining on measured degradation, and keep a simple fallback model in the safety loop. Foundation-model embeddings can reduce brittle overfitting, but they don't replace robust validation.
Ignoring Human Workflows
A technically excellent model that doesn't fit daily workflows fails. Alerts that lack context, require unfamiliar tools, or create extra admin work are ignored. Integrate outputs into the CMMS taxonomy, surface concise evidence, and design tiered actions that match planner authority.
Train planners and technicians on what predictions mean and how to annotate outcomes. Treat early adopters as co-designers, not just users. The teams that embed AI into decisions capture the most value, because adoption is as much a people problem as a models problem.
Practical Implementation Playbook
8 Step Execution Checklist
- Identify target assets and define business outcomes, quantify baseline downtime and costs.
- Verify data availability and schema consistency for chosen assets.
- Build a minimal ingestion pipeline with replayable raw archives.
- Run exploratory models and simple detectors to set baselines.
- Design pilot with success criteria, timebox, and control group.
- Integrate outputs with CMMS and operator workflows in shadow mode.
- Run pilots, collect closed-loop labels, and measure business KPIs.
- Promote incremental deployments, add monitoring, and codify governance before fleet rollout.
Each step must have explicit exit criteria. If sensors or labels are insufficient, stop and fix the pipeline before modeling.
Roles And Team Responsibilities
- Executive Sponsor, owns business outcome and funding.
- Reliability Engineer, defines failure modes and domain tests.
- Data Engineer, enforces ingestion contracts and metadata.
- ML Engineer, builds models, validation suites, and retraining pipelines.
- Site Champion/Technician, validates alerts, annotates outcomes, and drives adoption.
- Security/OT Lead, signs off on deployments and secures edge infrastructure.
- Product Owner/Integrator, maps outputs into CMMS and user workflows.
Small cross-functional pods with clear SLAs beat isolated teams. The teams building Physical AI infrastructure today will have an unfair advantage, because they learn both technical and operational patterns faster.
Templates For Pilot KPIs
Use a concise set of metrics to judge pilots:
- Uptime change, percent reduction in unplanned downtime, target 10 to 30 percent in first pilot.
- MTTR change, target 10 to 25 percent improvement.
- Precision at operating threshold (true positives / predicted positives), target >70 percent initially.
- False positive cost per month, measured in labor and parts.
- Ticket conversion rate, percent of alerts that become validated work orders.
- Data sufficiency, percentage of windows with full sensor and metadata coverage.
Tie each KPI to dollar impact and a payback timeline. Short pilots should focus on lead indicators like validated near-misses and ticket conversion rather than long-run availability alone.
Where AI Already Delivers
Manufacturing Case Examples
- Bearings and rotating equipment, where vibration signatures predict bearing wear weeks in advance, reducing catastrophic failures.
- Conveyor and drive systems, where current and temperature drift reveal misalignments before jams.
- Pumps and compressors, where acoustic and pressure patterns detect cavitation or seal failure early.
Each example turns raw high-frequency telemetry into actionable maintenance tasks, shrinking emergency repairs and spare parts waste.
Energy And Transportation Examples
- Wind farms, where gearbox and blade sensors predict failure windows that avoid turbine shutdowns during peak production.
- Substation transformers, where dissolved gas analysis plus thermal profiles catch insulation breakdown early.
- Rail and fleet operations, where axlebox vibration and motor current flag imminent bearing failures, preventing derailments or service interruptions.
These sectors benefit from cross-asset learning, because physical failure modes repeat across sites.
Typical Performance Improvements
Realistic early outcomes from disciplined pilots:
- 20 to 50 percent reduction in unplanned downtime on targeted assets.
- 20 to 40 percent faster MTTR due to better diagnostics and parts staging.
- False positives reduced by 30 to 60 percent after tuning and human-in-loop validation.
- Payback often within months for high-value assets, longer for low-margin equipment.
Numbers vary by asset criticality, data maturity, and operational buy-in. The best gains come where teams combine signal-rich telemetry, domain expertise, and repeatable governance so predictive intelligence becomes standard operating procedure.
Which Newton Agents Improve Equipment Uptime?
Everything above is achievable with conventional tooling, but it usually means building and maintaining a separate model for every machine, site, and failure mode. Newton Agents are Archetype's ready-to-deploy alternative: a portfolio of physical agents powered by Newton, Archetype AI's physical world model, pre-trained on billions of cross-modal sensor measurements so the same intelligence ports across assets, sites, and operating conditions.
Five agents map directly to the uptime workflow:
- Operational State Monitoring continuously interprets vibration, current, and temperature streams to reveal hidden operating regimes and the performance drivers behind them.
- Anomaly Discovery learns normal operation and surfaces emerging issues and unknown failure modes before thresholds trip.
- Rare Event Detection spots high-impact faults from only a handful of examples, no massive labeled dataset required.
- Task Verification confirms maintenance tasks are completed correctly and consistently from video and operational context.
- Manual Generation turns operational video into step-by-step SOPs and visual work instructions automatically, capturing expert know-how.
Each agent runs securely in the cloud, on-premises, or at the edge, keeping data under your control. The result is the shift this whole guide points toward: from reacting to failures to understanding and addressing them earlier, without building a bespoke model for every asset. Want to see what Newton Agents can do on your equipment? Request a demo and we'll show the agents in action and help you find the highest-impact place to start.
FAQs
Can I Use AI For Free?
Short answer, yes for prototyping, no for a full production solution.
You can experiment with open source models, community tools, and free cloud tiers to validate concepts and build demos. Those let you try anomaly detectors, RUL baselines, and simple LLM-driven log parsers without heavy spend. But predictive maintenance at scale requires more than models. You still need sensors, reliable ingestion, labeled events, edge compute or secure networking, and integration with CMMS, and those components carry cost. The physical world generates trillions of sensor signals, so the heavy lift is data engineering and operations, not the model license. Use free tools to prove value quickly, then budget for production elements: hardened edge, long-term storage, retraining pipelines, and governance.
Where To Download PDFs And Reports?
Start with three places, then vet quality.
- Academic repositories and conference proceedings, search with keywords like predictive maintenance, remaining useful life, and condition monitoring, then filter by year or venue.
- Industry and standards bodies, including trade associations and regulatory agencies, which publish practical guidance and field studies.
- Vendor whitepapers and case studies, useful for applied examples and cost metrics but treat them as directional, not scientific.
When you download, check for reproducible data or open datasets, look at sample sizes and site diversity, and read the methods so you know whether results are lab-scale or field-proven. Save citation details and any supplementary data so you can trace claims back to raw evidence.
Are There 2021 Studies Available?
Yes. Several 2021 papers and industry reports focused on transfer learning, self-supervised representations for sensor data, and early field trials in manufacturing and energy. They were important because they began shifting attention from pure supervised RUL to representations that work with scarce labels. Expect two patterns in that literature: promising accuracy in controlled settings, and limited cross-site validation. Use 2021 studies as a foundation, not a final answer. Look for follow-up work or meta-analyses that validate results across fleets. If you rely on a 2021 finding, re-run the experiment on your assets or a similar holdout site before committing to operational changes.
How Does Generative AI Help?
Generative AI expands what teams can do with both text and physical signals. LLMs unlocked intelligence over text, and generative models for sensor data start to do the same for the real world. Practical ways they help:
- Summarize maintenance logs and generate clear, consistent ticket descriptions from messy technician notes.
- Draft inspection checklists and troubleshooting steps tailored to predicted failure modes, saving planner time.
- Synthesize realistic sensor sequences to augment rare failure classes, improving model training when labeled events are scarce.
- Create counterfactual simulations for what-if analysis, helping planners compare intervention timings.
These tools speed diagnosis and training, but they must be grounded. Generations tied to telemetry and explainability work; hallucinated suggestions do not. Use generative outputs as assistant-level recommendations, not automatic actions, until you have rigorous validation and traceability. Archetype applies this with the Manual Generation agent, which turns operational video into step-by-step SOPs and visual work instructions automatically — capturing expert know-how before it walks out the door, a pressing concern as experienced personnel retire.
What Metrics Should I Track First?
Focus on metrics that connect model outputs to business outcomes and model reliability. Start with this prioritized set:
- Uptime or availability, absolute percent change, because that's the business signal senior leaders care about.
- MTBF and MTTR, to separate reliability improvement from faster repairs.
- Precision at operating threshold, so you know how many alerts lead to real work.
- False positive cost per month, measured in labor, parts, and production impact, to tune operating points.
- Ticket conversion rate, percent of alerts that become validated work orders, as a behavioral adoption metric.
- Lead indicators: validated near-misses and prevented emergency repairs, which show early value before long-run stats move.
- Data coverage, percent of windows with full sensor, metadata, and label availability, because models only work when data is reliable.
- Model calibration and drift signals, like Brier score and input distribution shifts, so you detect degradation early.
Set targets tied to dollar impact and a payback timeline. Track both technical and operational metrics together, because the teams building Physical AI infrastructure will gain compounding benefits when they measure what actually moves the business.
