
Archetype AI Team
False positives are the quiet tax on any industrial monitoring program: every nuisance alarm burns operator time and erodes trust in the system. It is a well-documented problem in the process industries (for example, chemical manufacturing, power generation, and oil and gas) where the sector's alarm-management guide, EEMUA 191 (2024 fourth edition, aligned with ISA-18.2 and IEC 62682), sets an explicit ceiling on how many alarms an operator should have to handle: no more than about 10 alarms per 10 minutes, a limit control rooms routinely blow past during process upsets. This guide covers what causes false positives, how to measure them, and how to tune detection so real events still surface.
What Causes False Positives?
Sensor Limitations And Noise
Sensors are physical devices with limits, drift, and blind spots. Electronic noise, quantization error, and sensor drift all create signals that look like events but aren't. Cheap or underspecified sensors amplify that problem, producing irregular pulses or spikes that trigger rules. Wiring faults, loose connectors, and firmware bugs add intermittent artifacts that confuse detection logic. The physical world generates trillions of signals, so even a tiny rate of sensor-level errors multiplies into many false alarms across an estate.
Poor Baselines And Static Thresholds
Static thresholds assume the world is steady, and it rarely is. Baselines that don't account for daily cycles, load patterns, or seasonal shifts will flag normal behavior as anomalous. As NVIDIA's engineering team notes, static cutoffs fail when signals drift (as equipment recalibrates or load moves between peak and off-peak) so a fixed threshold either misses real anomalies or floods operators with false alarms.
Teams often set thresholds from limited tests or worst-case thinking, then forget to revisit them. When the baseline is wrong, every rule looks noisy. The fix starts with measuring what normal actually is, not what you expect it to be.
Rule Overlap And Signature Ambiguity
Multiple rules can fire on the same underlying pattern, making a single physical event look like many incidents. Signature ambiguity happens when different causes produce similar sensor signatures, for example a temporary power dip versus a load spike.
Overlapping rules create alert storms that mirror the alarm floods long documented in the process industries — the alarm-management guidance in EEMUA 191, aligned with ISA-18.2 and IEC 62682, exists precisely to keep abnormal-situation floods from overwhelming operators. Tuning requires collapsing overlapping signatures into a single, actionable alert where possible.
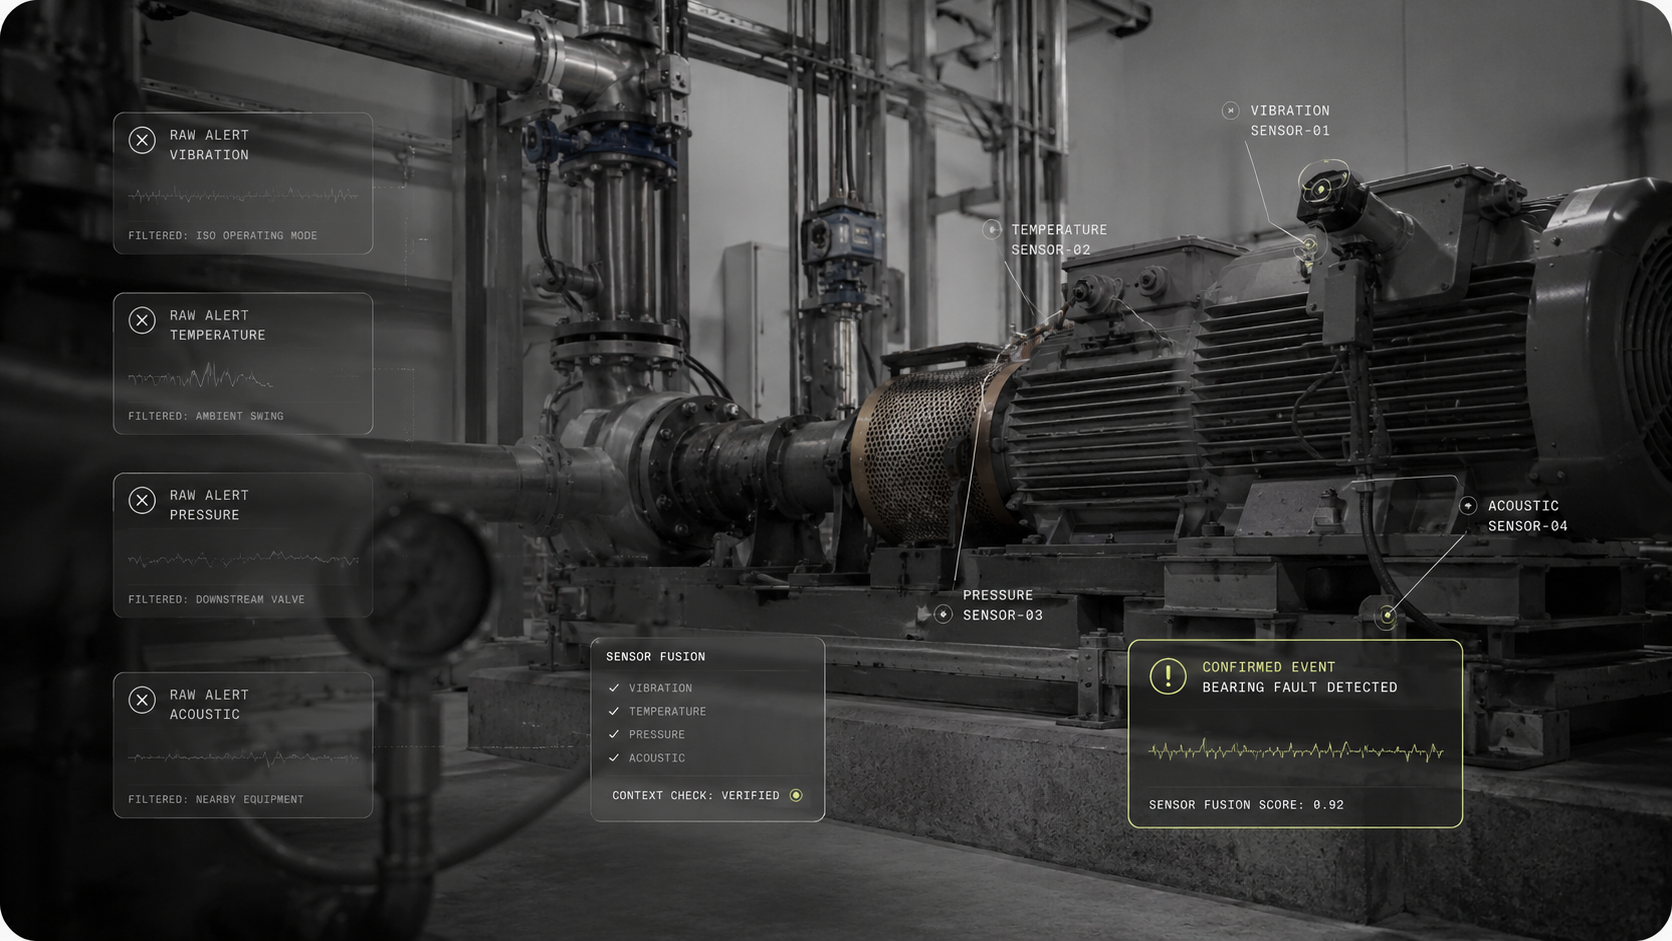
The ambiguity compounds fast as sensors multiply: a system with just two binary sensors already generates 1,536 possible interpretations, and adding a third pushes that to 24,576, far more than any hand-coded rule set can reliably disambiguate. A physical world model like Newton addresses this by fusing vibration, temperature, current, acoustics, and video into one shared representation and reasoning across them together, so correlated signals are read as a single forming failure instead of firing as separate, ambiguous alerts.
Environmental And Operational Changes
Context changes, like new equipment, shifted schedules, or weather, alter sensor behavior overnight. Maintenance, firmware updates, or layout changes can flip a previously rare reading into a common one. Operational processes, such as batch jobs or construction work, produce legitimate but unusual signals. When teams don't track these changes, detection models keep treating them as anomalies.
How To Measure False Positive Rates
Key Metrics To Track
Track precision, false discovery rate, and alert volume per asset. Precision tells you the share of alerts that were real. False discovery rate is the flip side, showing wasted effort. Also track mean time to acknowledge and time to resolve, those reveal operational burden. Measure alerts per device per day to surface noisy sensors. Use signal-to-noise ratio as a high level health indicator.
Building An Alert Inventory
Inventory every rule and alert type, link each alert to its source sensors and owners. For each entry capture historical counts, precision estimates, and typical triage time. Tag alerts with context like affected assets, environmental conditions, and business impact. An inventory turns vague "we have too many alerts" into a map you can prioritize, focusing on the handful of rules that generate most noise.
Establishing Targets And SLAs
Set concrete targets, for example less than 10 percent false discovery rate for high-priority alerts, or fewer than X alerts per device per week. Differentiate SLAs by impact, because tolerances vary. Low-severity noise can be bulk-suppressed, while critical systems require tighter precision. Tie SLAs to business outcomes, like reduced downtime or technician hours saved, so tuning work has clear ROI.
Visualizing Trends And Hotspots
Use time series dashboards, heatmaps by asset, and Pareto charts to surface noisy rules and sensors. Visualize alerts per rule over rolling windows to spot regressions after a change. Correlate spikes with deployments, maintenance events, or weather to find root causes. Visual patterns beat spreadsheets when you need to justify changes to ops teams.
How To Reduce Sensor Noise
Aggregate And Deduplicate Alerts
Group alerts that share causality into a single incident. Deduplication can be simple, like collapsing identical alerts within a time window, or smart, using common root cause indicators. Aggregation reduces cognitive load and focuses responders on the underlying problem, not the symptom multiplicity.
Apply Intelligent Suppression Windows
Suppress repeated alerts for the same event using dynamic windows that depend on event type and impact. Short windows for transient noncritical events, longer for recurring maintenance tasks. Intelligent suppression uses context, like device state or recent fixes, so you don't mask a new failure while avoiding a flood from a single root cause.
Use Sampling And Rate Limits
For very high cardinality signals, sample or throttle alerts to a manageable rate while still preserving detection coverage. Sampling works well for low-impact noise where a subset gives enough visibility. Rate limits prevent noisy sensors from consuming triage capacity, letting teams focus on signals that matter.
How To Tune Detection Rules
Adjust Thresholds With Data
Derive thresholds from historical distributions, not guesses. Use percentile-based thresholds for non-normal data, and compute context-aware bounds for diurnal or seasonal cycles.
Newer detection research points the same way: NVIDIA's anomaly-detection work replaces global cutoffs with adaptive thresholds that adjust to each operating regime, staying sensitive to real faults while suppressing the noise a static number would trip on. Validate changes with backtesting on historical streams before deploying. Data-driven thresholds reduce guesswork and anchor tuning in reality.
Use Adaptive And Contextual Windows
Move from fixed windows to adaptive ones that expand or shrink based on activity and context. Anomaly detection that conditions on operating mode, shift schedules, or nearby sensor states produces far fewer false positives. Contextual rules let models distinguish a real deviation from a benign operational state.
Version Control And Rollback For Rules
Treat rules like code. Use versioning, peer review, and staged rollout to avoid accidental noise spikes. Keep rollback paths so you can revert a rule that increases false positives. Audit trails also help diagnose why a rule changed behavior after a firmware update or a new asset was added.
Physical AI platforms are the next step in this playbook, which is why teams that build on them now gain an early advantage. Newton, Archetype AI's physical world model, is pre-trained on billions of cross-modal, cross-domain sensor measurements and learns how machines and environments actually behave. Because it works from observation rather than hard-coded rules, it can surface both known and unknown anomalies — the kind a threshold tuned for yesterday's failure modes would miss. That way, detection starts smarter instead of being shaped one rule at a time.
This is already cutting false alarms in production: at one process manufacturer, Newton pinpointed the sensor signals behind each unplanned line break and prevented roughly half of them, and on a low-cost edge device at each pump it tells healthy operation from early degradation in real time — adding runtime while cutting false-alarm shutdowns.
How To Use Contextual Enrichment
Add Asset And Identity Context
Link every sensor reading to the asset it came from, the device metadata, and who owns it. Include firmware versions, maintenance history, installation date, and physical location so similar spikes can be interpreted differently by asset class and lifecycle stage.
Tie sensor events to identities, whether a technician, operator, or automated process, so human-caused patterns are not misclassified as faults. When alerts carry that context, triage becomes faster and rules can target root causes instead of symptoms. The physical world produces trillions of signals, so this extra metadata is the multiplier that turns raw pulses into meaningful events.
Integrate Threat Intelligence Feeds
Bring in external context that changes how you score an event, for example regional grid outages, weather warnings, scheduled construction, or known attack indicators. Use feeds as signals of increased risk, never as sole decision makers, and record feed confidence and expiry to avoid stale enrichment. Correlate external events with local telemetry to suppress benign matches, or to escalate when a local anomaly aligns with a credible external threat. Provenance matters, keep feed lineage so you can audit why an alert was suppressed or promoted.
Enrich With Behavioral Baselines
Build baselines that are per-asset, per-location, and per-operating-mode, not one-size-fits-all. Capture daily and seasonal cycles, load profiles, and normal multi-sensor relationships, then use deviations against those baselines to score anomalies. Cluster similar assets to share baselines when data is sparse, and allow baselines to be mode-aware so maintenance or shift changes aren't treated as faults.
A physical world model like Newton can accelerate baseline creation, learning typical dynamics across large estates so you start with better priors and reduce false positives from day one. Because Newton is pre-trained on billions of cross-modal, cross-domain sensor measurements, it reaches roughly 80% accuracy on machines it has never seen and adapts to a new asset from as little as one labeled example. It means that even sparse-data assets inherit strong baselines instead of starting from a noisy blank slate.
How To Use Automation And ML Safely
Automate Triage, Not Blind Closure
Automate tasks that reduce human workload, like enrichment, prioritization, and routing, while keeping final closure in human hands except for very high-confidence cases. Use automation to surface recommended actions and confidence scores, not to delete evidence. Maintain a human-in-the-loop for edge cases and for any remediation that impacts safety or operations. Automation should lower noise, not hide it.
Choose Supervised Versus Unsupervised Models
Pick supervised models when you have labeled incidents and need precise classification, accept the labeling cost for higher precision. Use unsupervised or semi-supervised methods when you need to discover new failure modes, knowing they will produce more false positives initially. Hybrid workflows work well, run unsupervised detectors to flag candidates, then route samples for labeling to grow supervised coverage. Transfer learning from a physical world model like Newton, pre-trained on billions of sensor measurements, can reduce the labeled-data burden.
Monitor Model Drift And Performance
Track precision, false discovery rate, calibration, and latency as part of normal operations, not as an annual report. Detect feature drift and input distribution shifts, trigger shadow runs or retraining when performance degrades, and keep model versioning with rollback paths. Validate model changes against historical windows and use A/B testing where possible, so a new model does not increase noise in production. Continuous measurement is how you keep ML from becoming a silent source of false positives.
How To Build Feedback Loops
Capture Analyst Labels And Notes
Make it effortless for analysts to label alerts with structured outcomes, confidence, and a brief rationale. Store free-text notes too, but pair them with discrete tags for automated consumption. Good labels are the currency of better detection, they train models, refine rules, and reveal systematic sources of noise. Track who labeled what and when, so you can weight recent, expert input more heavily.
Run Regular Retrospectives
Schedule focused reviews of the top false positive drivers, include ops, engineering, and data science, and make the session action-oriented. Use an alert inventory and visual trends to prioritize fixes that deliver the most reduction in noise per hour of work. Treat retrospectives as a feedback mechanism, not a blame game, and publish concise outcomes so fixes are implemented and verified.
Feed Corrections Back To Rules And Models
Operationalize analyst corrections, convert recurring fixes into rule changes or training examples, and automate low-risk updates with peer review. Maintain a pipeline that turns triage outcomes into test cases for both rules and models, and measure whether each correction reduces future false positives. Close the loop deliberately, because labeling without operationalization just creates paperwork.
How To Design Sensors And Placement
Pick The Right Telemetry Types
Choose signals that get you closer to root cause, not just more of the same symptom. For rotating machinery combine vibration, temperature, and current; for mobile assets combine power, GPS, and IMU. Diverse modalities reduce signature ambiguity and let algorithms triangulate real faults from noise. Be pragmatic, higher fidelity sensors help, but only where the signal improves decision quality enough to justify cost.
Balance Centralized Versus Edge Collection
Keep raw data centrally for auditability, but do simple preprocessing at the edge to reduce bandwidth and early noise, for example local filtering, thresholding, or burst capture on events. Edge logic can collapse redundant samples into an event, while the central system performs richer correlation and historical baselining. Design the split so you never lose the context needed to investigate a suppressed alert.
Optimize Sampling Frequency And Granularity
Set sampling to capture relevant dynamics, not to satisfy curiosity. High frequency uncovers fast transients but increases noise and storage costs, low frequency can miss key signatures. Use adaptive sampling, such as baseline-rate collection with event-driven bursts, and multiresolution streams so you can zoom in retrospectively without drowning in raw data. Match granularity to failure modes, and regularly revisit those settings as operating conditions change.
How To Test And Validate Detections
Use Synthetic And Replay Tests
Create deterministic synthetic scenarios that exercise edge cases sensors rarely produce, for example power transients, cable faults, or simultaneous sensor dropouts. Replay historical streams with injected anomalies to measure how rules behave against real noise and seasonal patterns. Keep a library of golden traces, labeled with expected outcomes, and run them automatically on every rule change so regressions are caught before production.
Conduct Red Team And Canary Exercises
Run adversarial exercises that simulate operator mistakes, maintenance events, and malice, then observe which detectors fire and how responders react. Canary deployments let you test rule changes on a small subset of assets or time windows, so you can measure human workload and precision without risking the whole estate. Use outcomes from red team and canary runs to build realistic acceptance criteria for wider rollouts.
Measure Detection Precision Before Rollout
Define pass/fail thresholds for precision and false discovery rate tied to the alert's impact, then validate on holdout data. Run shadow mode so new rules score alerts without affecting workflows, compare predicted labels to analyst outcomes, and iterate until precision targets are met. Record these validation results in the rule inventory to make rollout decisions traceable and repeatable.
How To Balance False Positives And Negatives
Quantify Business Impact Of Errors
Assign dollar or time costs to false positives, like wasted technician hours, and to false negatives, like downtime or safety incidents. Use those costs to compute an expected loss for each rule, so tuning decisions optimize business outcomes, not abstract metrics. Remember some environments prioritize missing nothing, while others tolerate more noise to avoid missing a critical failure.
Use ROC Curves And Precision Metrics
Plot ROC and precision recall curves for detectors to see tradeoffs across thresholds, then pick operating points that match your loss function. For skewed classes, prioritize precision recall over ROC, and track calibration so confidence scores map to real-world probabilities. Use F-beta scores to encode whether you care more about catching issues, or about avoiding false alarms.
Set Risk-Based Tolerance Levels
Classify assets and alerts by criticality, then apply stricter precision targets to high-risk systems and looser ones to low-risk telemetry. Make tolerances explicit, for example 95 percent precision for life-safety alerts, 80 percent for routine maintenance. Revisit tolerances after major context changes, and let automation suppress low-impact noise while routing high-risk anomalies to fast human review.
Playbook For Tuning And Response
Initial Triage And Classification Steps
When an alert arrives, first validate the sensor health and timestamp to rule out ingestion issues. Enrich the event with asset metadata, recent maintenance, and environmental feeds before assigning a severity. If the signal matches a known incident signature, tag it accordingly and follow the corresponding runbook; if not, escalate for investigation and label the outcome for future training.
Stepwise Rule Tuning Workflow
Start with hypothesis, then reproduce the behavior in a sandbox using replay tests. Adjust one parameter at a time, backtest against historical windows, and run the changed rule in shadow mode. Promote to a canary subset only after precision and triage time improve, monitor for unintended side effects, and commit changes to version control with clear rationale and test results.
Escalation And Documentation Practices
Map severity tiers to escalation paths and response SLAs, include contact roles and expected actions for each tier. Log every tuning action, why it was made, and the validation used, so future teams can trace regressions. After significant incidents, run a brief postmortem that updates rules, baselines, and playbooks, then verify the fix with replay tests.
Checklist For Ongoing Maintenance
Scheduled Rule Reviews
Set a cadence based on impact, for example monthly for high-priority alerts and quarterly for low priority ones. During reviews, check precision trends, owner confirmation, and whether the rule still maps to an active business process. Archive or retire rules that haven't fired in a long time or that consistently underperform.
Data Quality And Pipeline Health Checks
Monitor sensor uptime, missing sample rates, timestamp skew, and distribution drift as first-class operational metrics. Alert when pipelines introduce latency or when feature distributions shift beyond thresholds, because these issues are common sources of sudden false positives. Keep synthetic sanity checks that verify end-to-end ingestion and enrichment every deployment.
Automation Audit And Access Reviews
Regularly audit automation actions, suppression rules, and any auto-remediation to ensure they executed as intended and didn't mask problems. Review who can change detectors, promote canaries, or approve model retraining, and rotate privileges if ownership changes. Maintain an audit trail for automated updates so you can quickly roll back any automation that increases noise.
Common Mistakes To Avoid
Sensors are messy, teams are busy, and small mistakes compound quickly. These are the common traps that turn manageable noise into a crisis of confidence.
Over-Suppressing Alerts
Suppressing too aggressively hides real problems. Blanket suppression windows or blanket muting of noisy devices silence the few true positives buried in the noise, so you trade short-term quiet for long-term blind spots. Suppress with context, not blanket rules, and require metadata that justifies continued suppression, for example maintenance tickets or known outages. Use canary policies so suppression that looks safe on a sample doesn't break detection at scale.
Ignoring Seasonal Or Contextual Shifts
Static baselines fail when context shifts, and context changes all the time, from weather to schedules to new equipment. If you treat yesterday's "normal" as permanent, you'll get floods of false positives every season change or after a process update. Make baselines mode-aware, surface drift alerts when distributions move, and version baselines with a timestamp and owner so changes are deliberate and auditable.
Relying Solely On Blackbox Models
Blackbox models can detect patterns you missed, but they also produce inscrutable alerts that are hard to trust. If ops can't see why a model fired, they'll either ignore it or escalate everything. Prefer models that provide interpretable signals, use ensemble approaches that combine rules and learned detectors, and pair model outputs with provenance and confidence so humans can validate and feed back corrections.
A physical world model like Newton can give better priors by flagging both known and unknown anomalies by observation rather than hard-coded rules. However, you still need that transparency and operational control. Newton helps close that transparency gap by reporting anomalies as named operational states in plain language rather than opaque scores, giving operators a reason they can act on.
FAQs
How Can Teams Minimize False Negatives In Alerting?
Increase coverage, diversify signals, and lower barriers to detection for critical classes. Practical steps: add complementary telemetry so faults don't hinge on a single sensor, use supervised classifiers trained on labeled failures, and run targeted injection tests to validate end-to-end detection. Use shadow and canary deployments to tune sensitivity without impacting ops, and prioritize retraining when drift is detected. For hard-to-observe failure modes, a physical world model like Newton can surface subtle precursors earlier. Newton's rare-event detection is built for exactly this — it can catch rare, high-impact faults from only a handful of examples, the failure modes that most often slip past supervised models starved of labeled data.
What Impact Do False Negatives Have On Response?
They delay detection and remediation, amplify downtime, and can create safety or compliance failures. Missed events erode trust in monitoring, so responders stop relying on alerts and the organization becomes reactive instead of predictive. Quantify the impact in technician hours, lost revenue, or safety risk to make tradeoffs explicit when tuning sensitivity.
How Do False Positives Differ From False Negatives?
A false positive is an alert when nothing needs attention, a false negative is a missed real event. Consequences diverge: false positives waste time and cause alert fatigue, false negatives allow problems to grow undetected. Tuning is a tradeoff, you must pick operating points that match business risk, for example accepting more noise on low-risk systems while minimizing misses on life-critical assets.
What Are Practical False Negative Examples?
- A temperature sensor that drifts slowly and never crosses a static threshold, so an overheating pump fails without an alert.
- A telecom cell that degrades intermittently, but aggregated metrics smooth the degradation and no alarm fires until customer impact appears.
- A construction site vibration signature that precedes structural failure, missed because only single-axis vibration was monitored.
- A smart-city camera pipeline that drops frames during a spike, hiding an unauthorized entry.
Each example shows the same root issues: insufficient modalities, poor sampling, or thresholds that don't account for real failure modes.
Which Metrics Indicate Detection Quality?
Use a mix of probabilistic and operational metrics, and map them to business outcomes. Key ones:
- Precision, the share of alerts that were real.
- Recall, the share of real incidents you actually caught.
- False discovery rate and false negative rate, for direct operational cost estimates.
- Precision-recall AUC for imbalanced classes, ROC AUC when classes are balanced.
- Calibration, so confidence scores reflect actual probabilities.
- Mean time to acknowledge and mean time to resolve, to measure operational burden.
- Alerts per asset per day, to find noisy devices.
Tie these metrics to dollar or time costs so tuning targets optimize expected loss, not just abstract numbers.